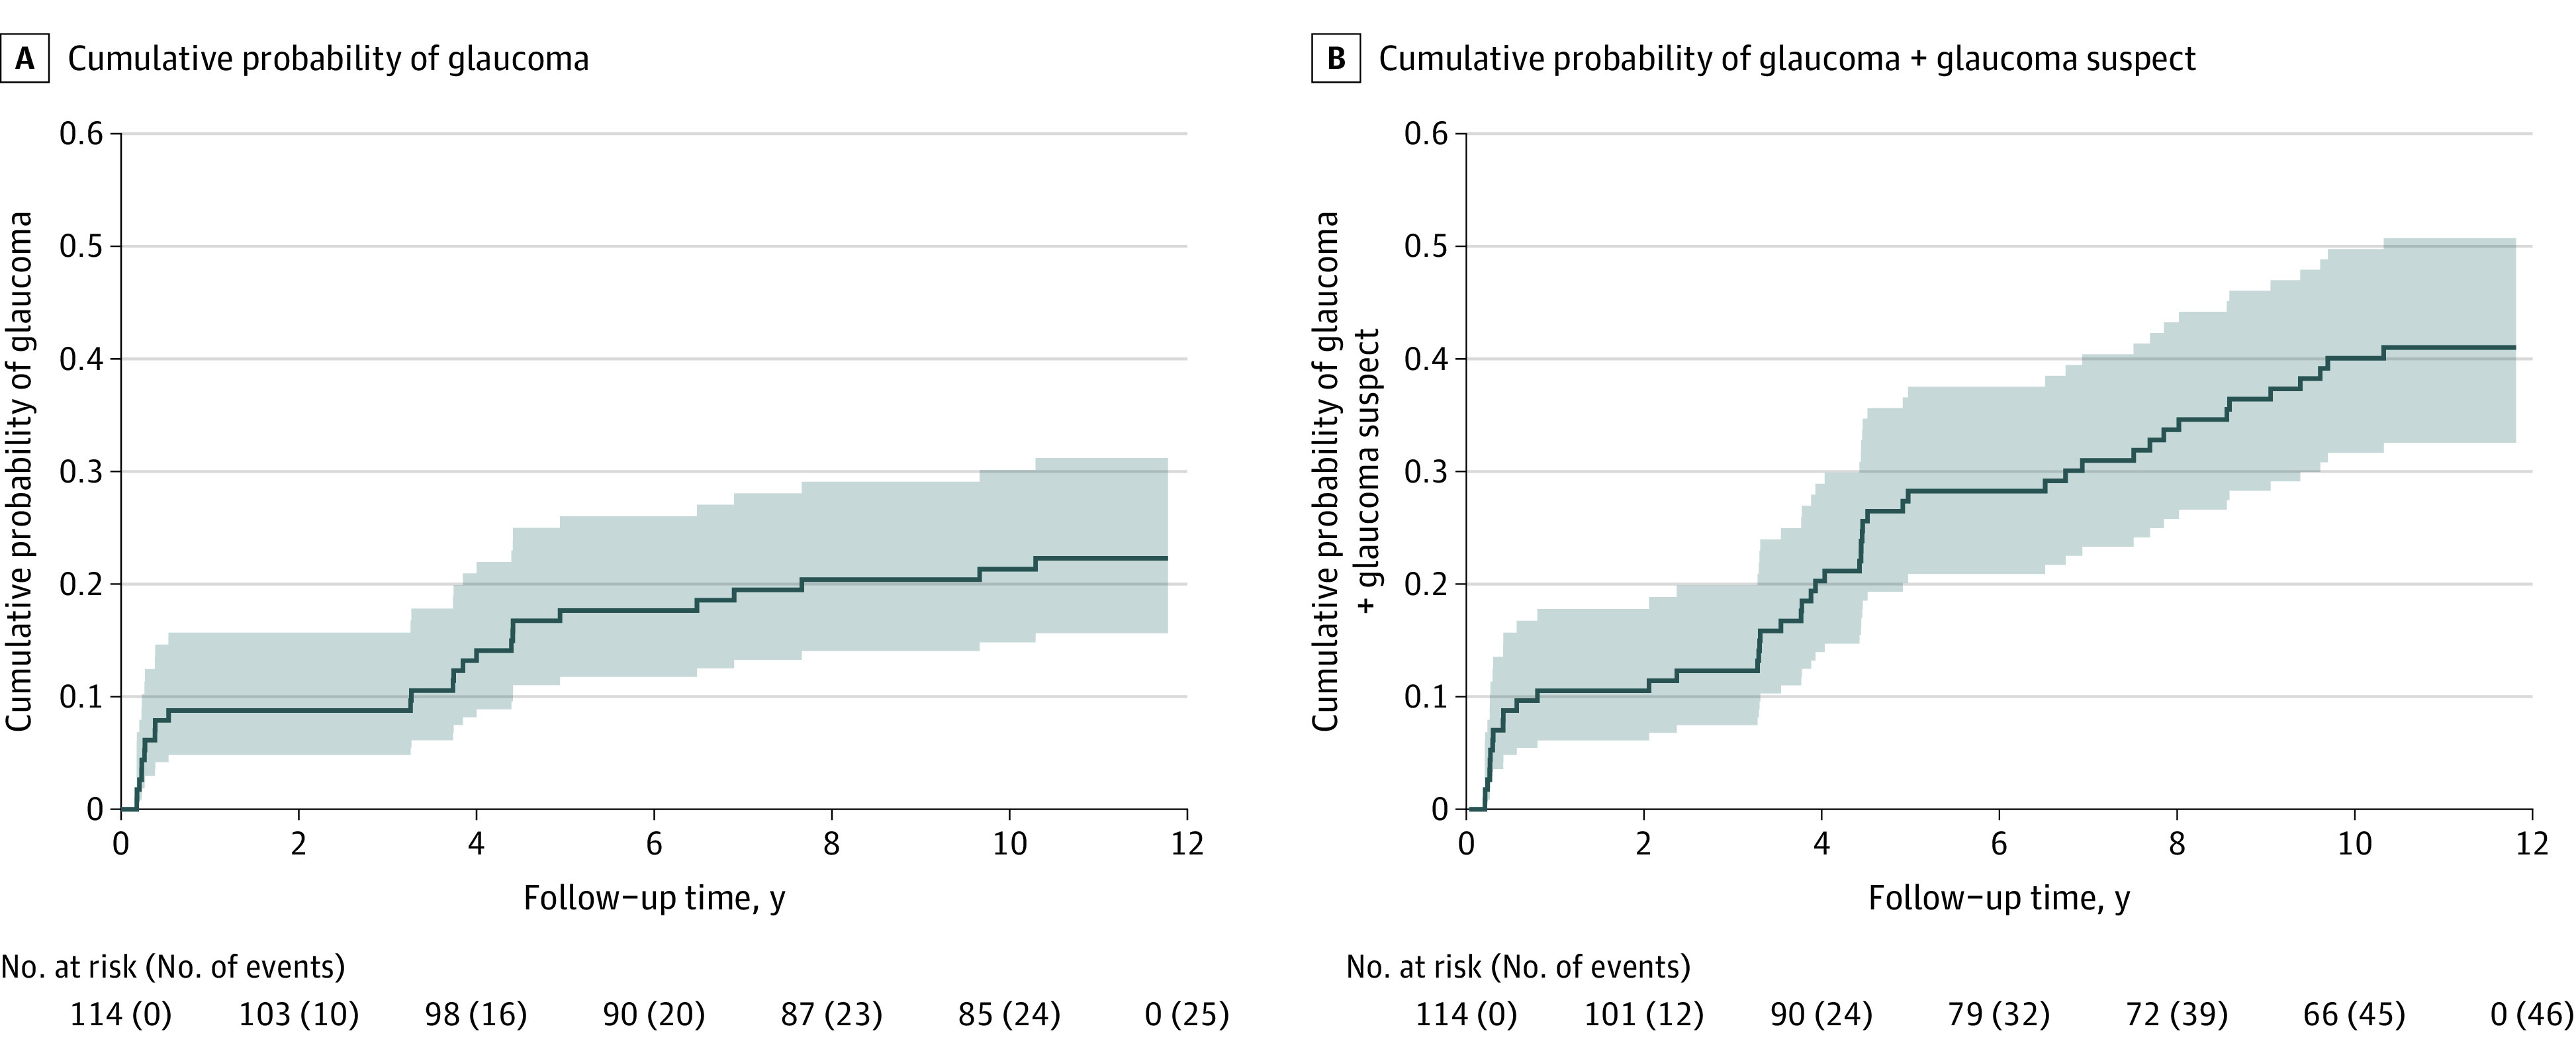
Figure 2. Kaplan-Meier Curves Showing Cumulative Probability of Glaucoma (A) and Glaucoma + Glaucoma Suspect (B) vs Time (in Years) Since Cataract Surgery for 114 Study Participants.

The shading denotes 95% confidence intervals for the cumulative probability. The numbers of participants at risk and the cumulative numbers of events are shown below the x-axis. The 10-year cumulative probability was 22% (95% CI, 16%-31%) for glaucoma and 40% (95% CI, 32%-50%) for glaucoma + glaucoma suspect.
