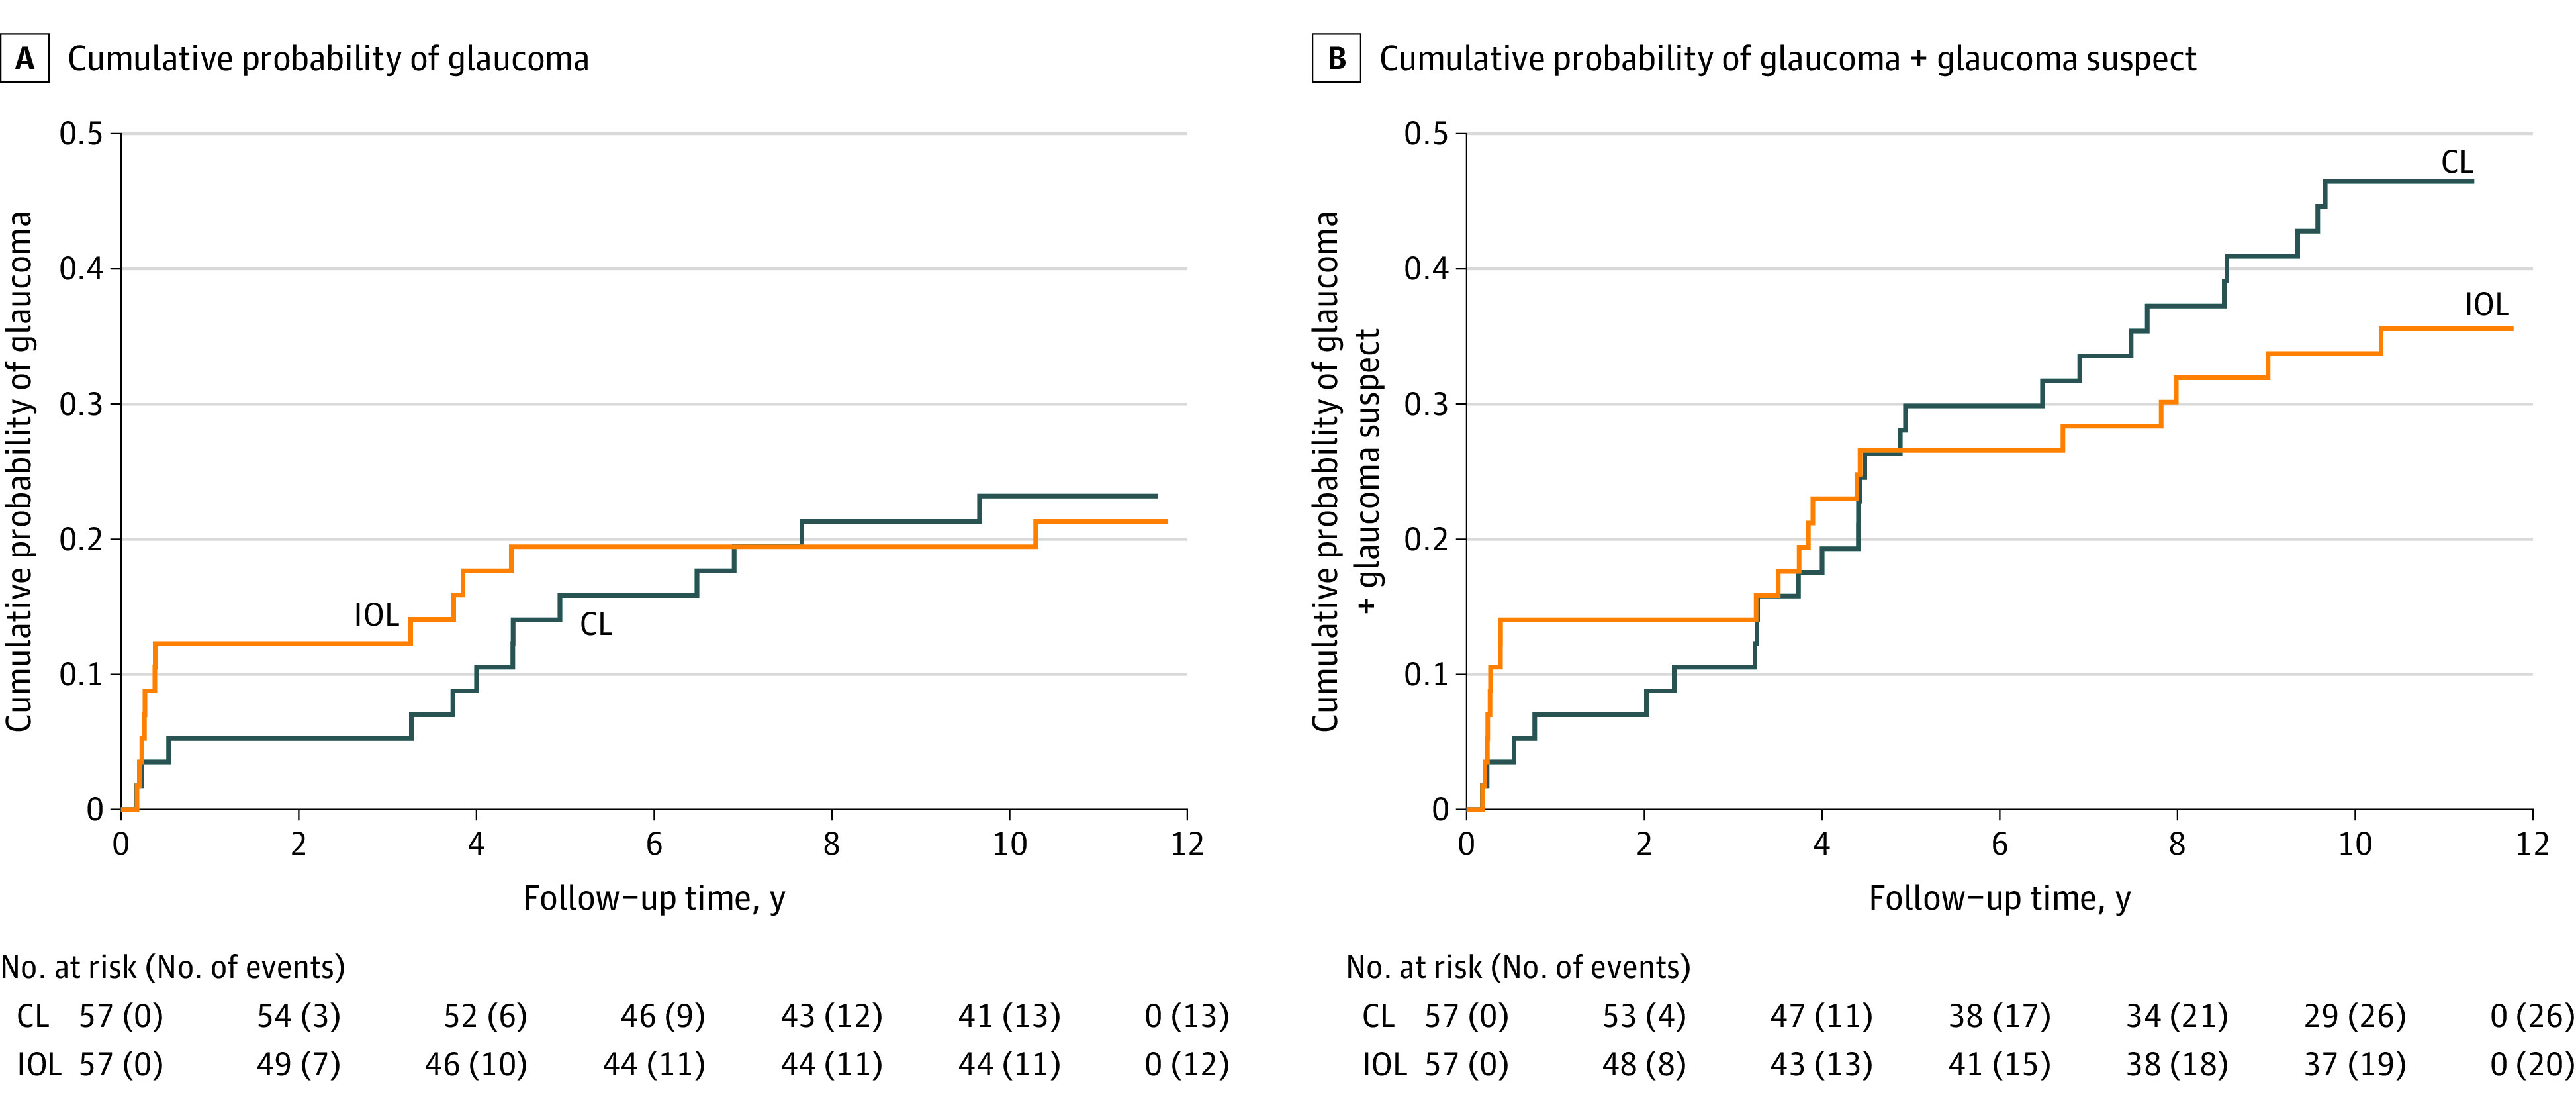
Figure 3. Kaplan-Meier Curves Showing the Cumulative Probability of Glaucoma (A) and Glaucoma + Glaucoma Suspect (B) vs Time (in Years) Since Cataract Surgery for the Contact Lens (CL) and Intraocular Lens (IOL) Groups (57 Participants in Each Group).

The numbers of participants at risk and the cumulative numbers of events are shown below the x-axis. At 10.5 years, the cumulative probability of glaucoma was 23% (95% CI, 14%-37%) for the CL group and 21% (95% CI, 13%-35%) for the IOL group. The 10-year cumulative probability of glaucoma + glaucoma suspect was 46% (95% CI, 34%-60%) for the CL group and 36% (95% CI, 25%-50%) for the IOL group.
