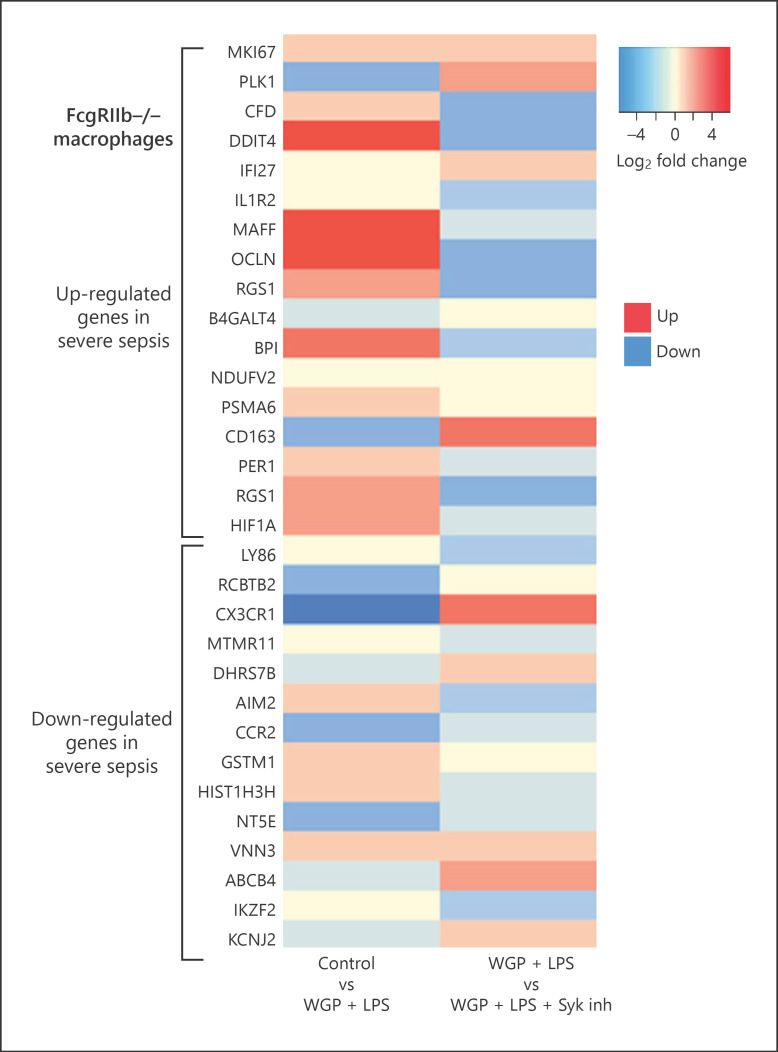
Fig. 5.
Comparison of gene expression between activated macrophages and patients with severe sepsis. A heat map comparison of the up- and downregulated genes in macrophages associated with genes expressed in patients with high mortality rate sepsis. Left column: fold change in gene expression after activation of FcgRIIb−/− macrophages by whole glucan particle (WGP), a representative of (1→3)-β-D-glucan, and LPS (WGP + LPS) versus Control. Right column: fold change in gene expression of FcgRIIb−/− macrophages activated by WGP + LPS with Syk inhibition (WGP + LPS + Syk inh) versus no Syk inhibition (WGP + LPS).

