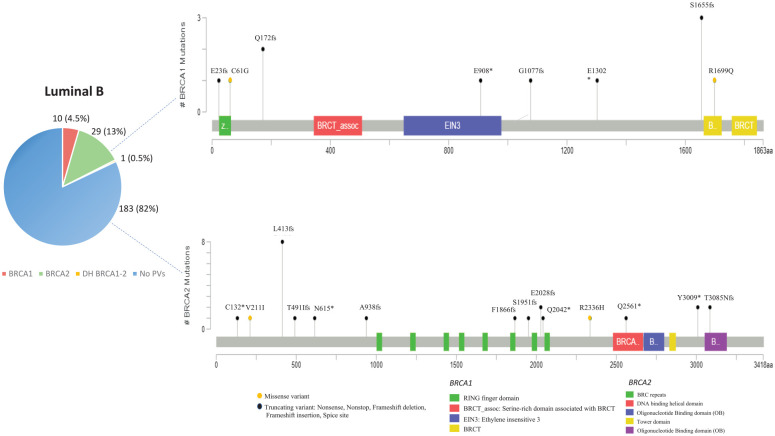
Figure 3.
Lollipop plots showing the distribution and frequency of BRCA1 and BRCA2 PVs identified in luminal B breast cancer patients. The plots were obtained by the informatic tool Mutation Mapper-cBioPortal for Cancer Genomics (GenBank Reference BRCA1: NM_007294 and GenBank Reference BRCA2: NM_000059). The Intronic Variant Sequences (IVS) are not shown in the lollipop plots. The lollipop height indicates the frequency of BRCA1/2 PVs in different molecular subgroups of our study cohort.

