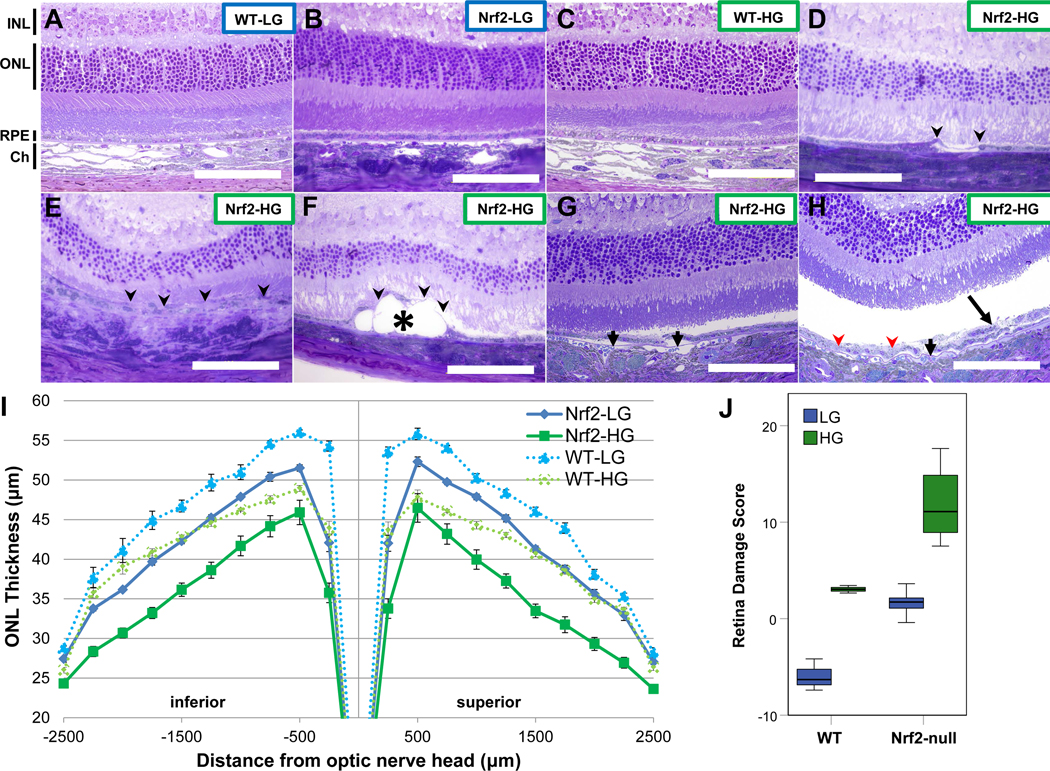
Figure 2.
Nrf2-HG mice develop features of atrophic age-related macular degeneration. (A-H) Toluidine blue stained sections through the retinas of WT-LG (A), Nrf2-LG (B), and WT-HG (C), have normal architecture: INL layers from neural cells, ONL layers from photoreceptors, the RPE, and the choroid are all clearly observed. In contrast, Nrf2-HG mouse retinas (D-H) show multiple lesions including: RPE atrophy (arrowheads), deposits (asterisk), RPE detachments from Bruch’s membrane (short arrows), hypopigmentation (red arrowheads), and multilayered/dysmorphic RPE (long arrow). Higher magnification images of Figures 2A–H are shown in Supplementary Figure 1. (I) Measurement of ONL thickness across the retinas of each dietary and genotype group indicates moderate thinning of WT-HG and Nrf2-LG ONL, but severe thinning of Nrf2-HG ONL relative to WT-LG ONL. (J) Boxplots of retina damage score, based on the area under the ONL thickness plot, show increased retina damage score in Nrf2-HG mice compared to all other groups. Abbreviations: Ch-choroid, INL-inner nuclear layer, ONL –outer nuclear layer, RPE –retinal pigmented epithelium. Data points in (I) indicate means and error bars indicate SEM. Sample size is n=10 (Nrf2-HG), n=11 (Nrf2-LG), n=3 (WT) in (I,J). Scale bar is 100μm.

