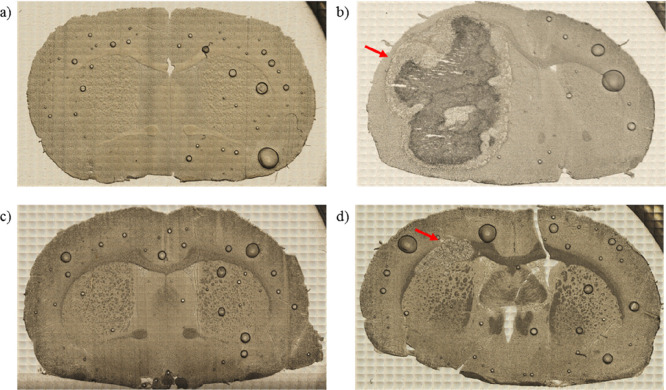
Figure 1.
Microscopic images of unstained tissue slices taken from animals representing N (a), U (b), T (c), and P (d) groups. N group consisted of naive controls, while animals from groups U, T, and P were subjected to implantation into the brain of U87MG, T98G, and patient tumor-derived cells, respectively. Red arrows indicate developed tumor mass.

