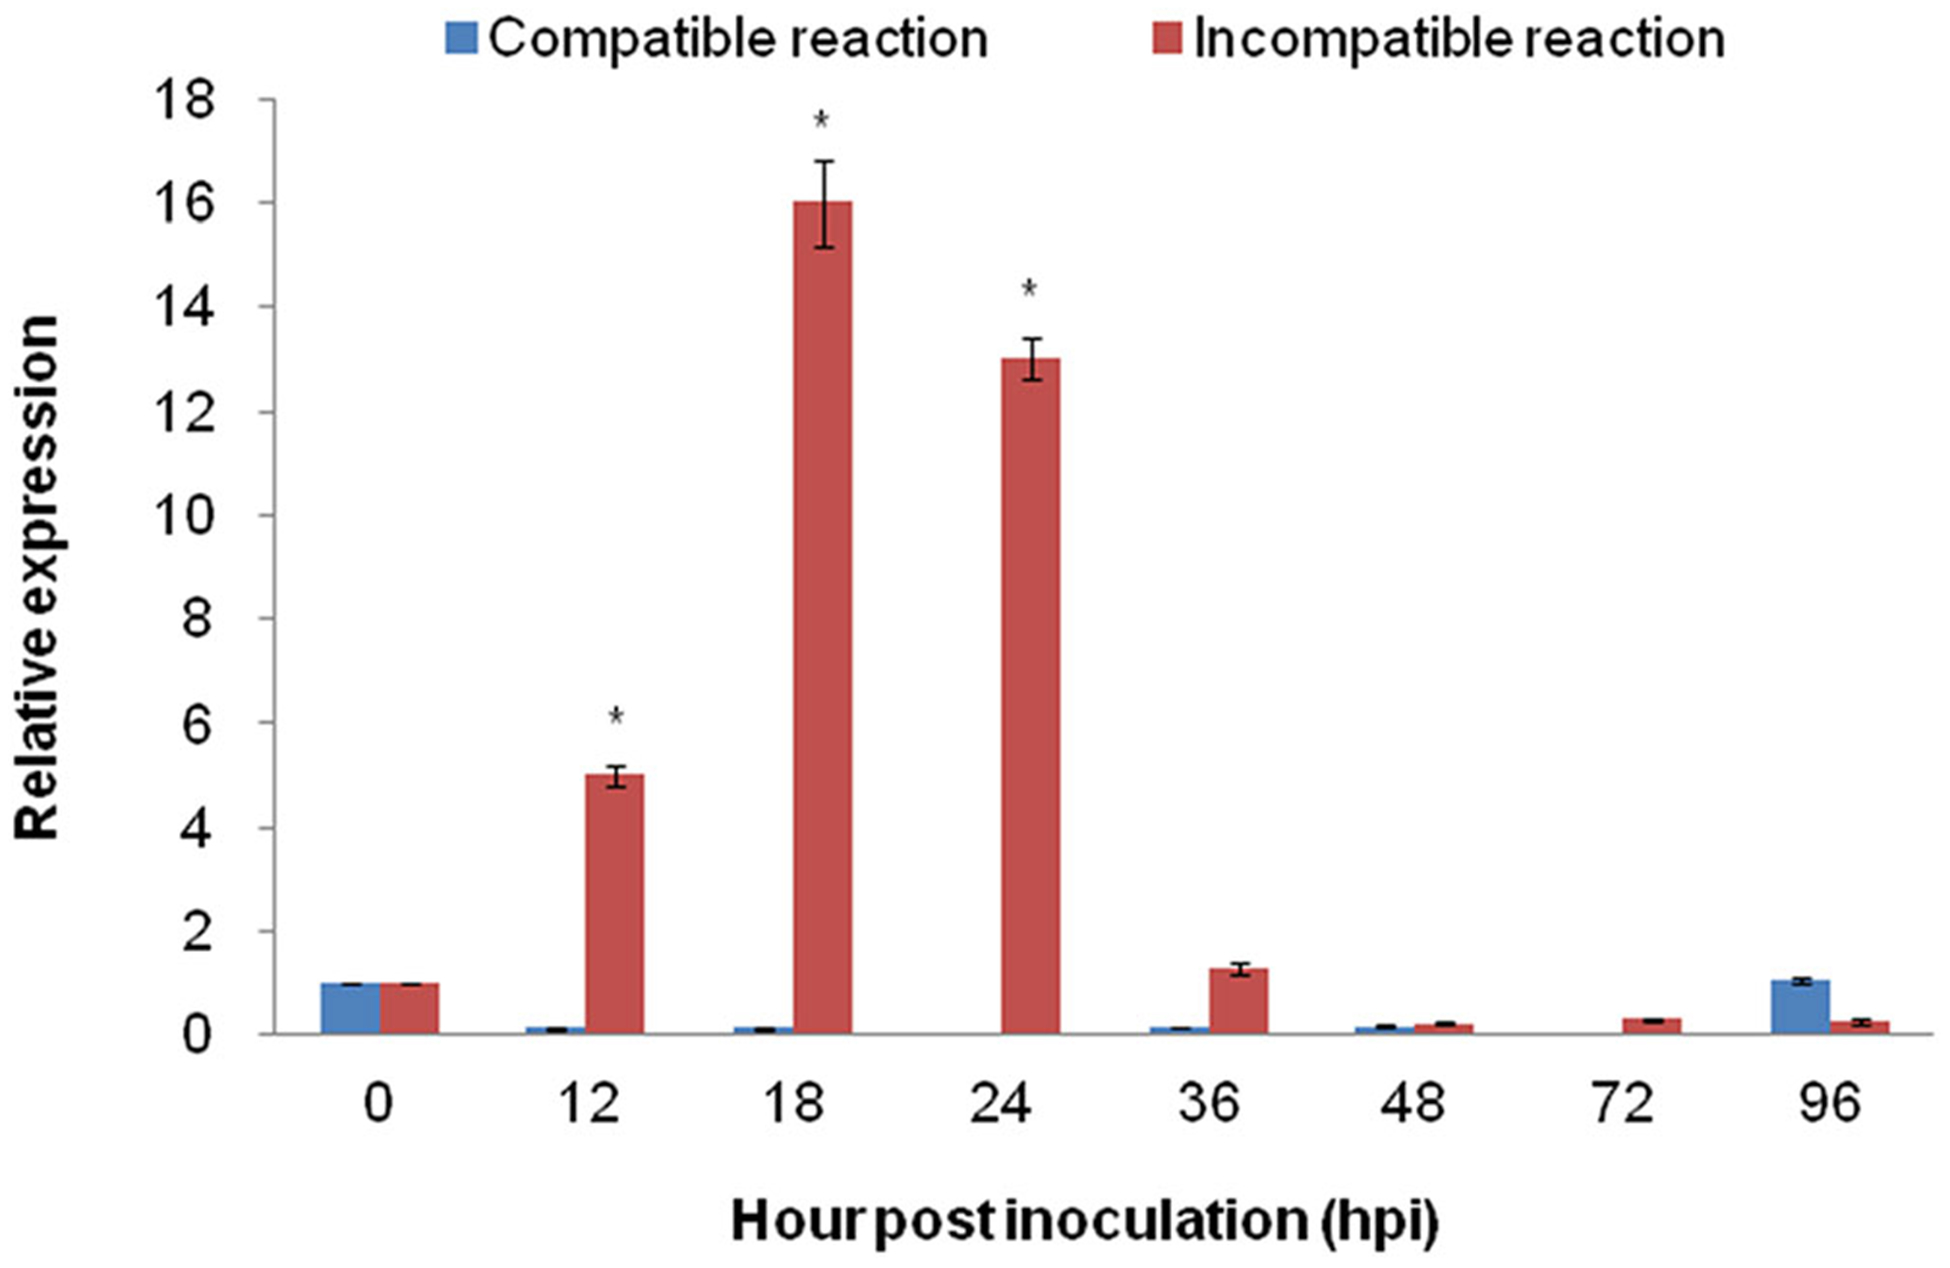
FIGURE 3.

Quantitative real-time PCR expression analysis of ARPC3 in tomato leaves. The expression level of ARPC3 in tomato leaves was induced in incompatible reaction between tomato-On-Lz interaction. Error bars represent standard deviation from three independent replicates. Asterisks (*) indicate significant difference (P < .05) from 0 hpi using Student’s t test
