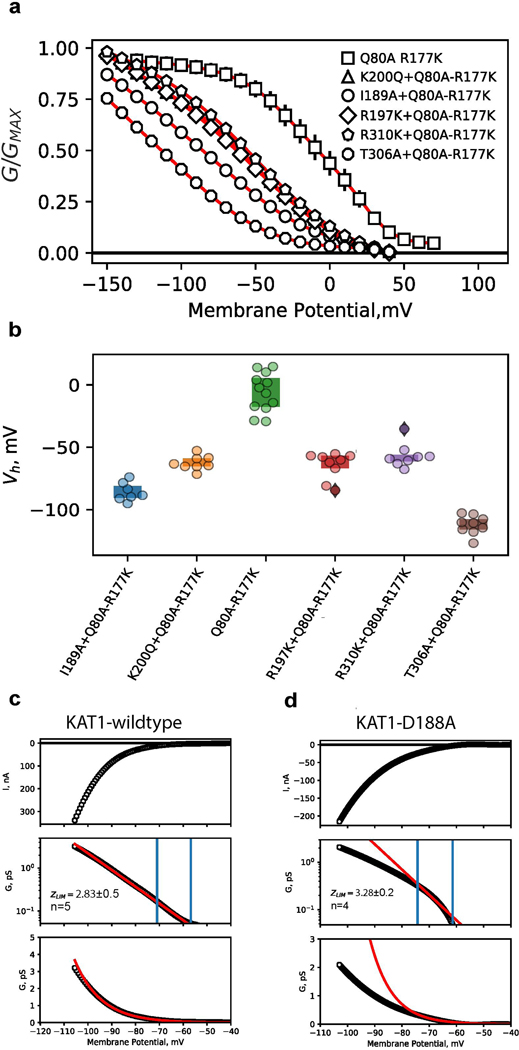
Extended Data Figure 7: Detailed functional characterization of selected VSD-pore interface mutants.
a, G-V relations for cRNA mixing-coinjection experiments. cRNA encoding loss-of-function (LOF) mutants (I189A, R197K, K200Q, T306A, R310K), for which no currents were observed were selected. These LOF cRNAs were each individually mixed with cRNA encoding a gain-of-function double mutant (Q80A-R177K). Error bars are SEM and symbols represent the mean. Shown are Q80A-R177K (n=12), I189A+Q80A-R177K (n=7), K200Q+Q80A-R177K (n=8), R197K+Q80A-R177K (n=9), R310K+Q80A-R177K (n=8), T306A+Q80A-R177K (n=9) b, Plot of activation midpoints (V1/2) of G-V relations shown in, a. c, d, Limiting slope analyses for KAT1 wildtype, c, and D188A, d. Top panels show raw currents evoked by voltage ramp protocol. Middle panels show conductance-voltage relations, with conductance plotted on a log scale. Data points are black, fits are red. Blue vertical lines mark the first and second inflection points of the curve, the region between which was used to calculate limiting slope (z) values (see methods). For wildtype, z = 2.83±0.5, for D188A z = 3.28±0.2 (values are given as mean ± SD). Bottom panels show data (black) and fits (red) on linear scale. In all panels n = X biologically independent cells.

