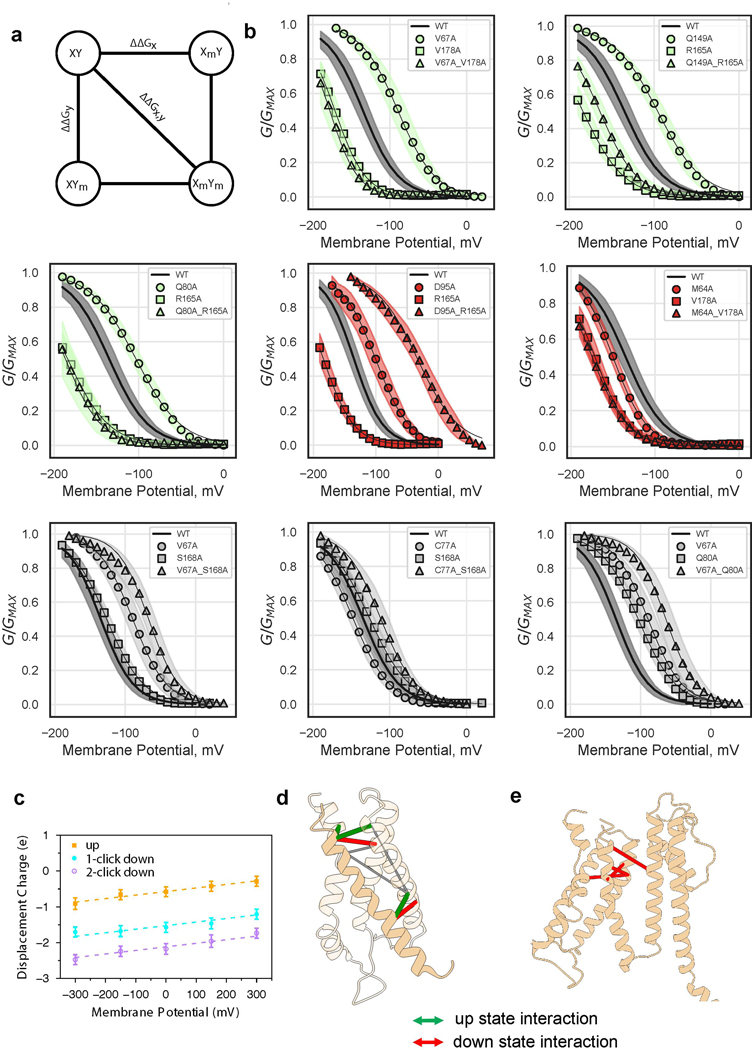
Extended Data Figure 8: VSD movement during gating.
a, Schematic of double mutant cycle analysis. The difference between ΔΔGx,y and the quantity (ΔΔGx + ΔΔGy) determines the extent of differential interaction between residues x and y, in the up and down states. b, G-V relations for single and double mutants, illustrating residue-residue pairs displaying additivity (Gray) and non-additivity in different directions (Green, up-state-interaction and Red, down-state-interaction). Shaded error regions represent standard deviation, surrounding the symbols which represent the mean. Shown are wild-type (n = 11), M64A (n = 11), V67A (n = 33), C77A (n = 15), Q80A (n = 11), D95A (n = 12), Q149A (n = 21), R165A (n = 21), S168A (n = 17), V178A (n = 19), M64A-V178A (n = 15), V67A-Q80A (n = 13), V67A-S168A (n = 16), V67A-V178A (n = 10), C77A-S168A (n = 14), Q80A-R165A (n = 6), D95A-R165A (n = 5), Q149A-R165A (n = 14) where n = X biologically independent cells. c, Displacement of charge for the isolated VSD in the up, one-click down, and two-click down conformations at different transmembrane potentials. Shown are the mean values and standard deviations calculated using the last 40 ns snapshots (n = 4000) of 50 ns trajectories. Each system was simulated once at each chosen potential. The gating charge is then calculated as the offset constant between the linear fits, resulting in a gating charge of 1.02 e and 0.55 e between the up and one-click down, and one-click down and two-click down states, respectively. d, Mapping of double mutant cycle constraints onto ‘up’ VSD structure. Thick red and green lines connect Cα carbons of interacting pairs. Thin gray lines connect negative control pairs. e, Mapping of literature KAT1 down state interacting pairs21 onto ‘up’ structure. Thick red lines connect Cα carbons of interacting pairs.

