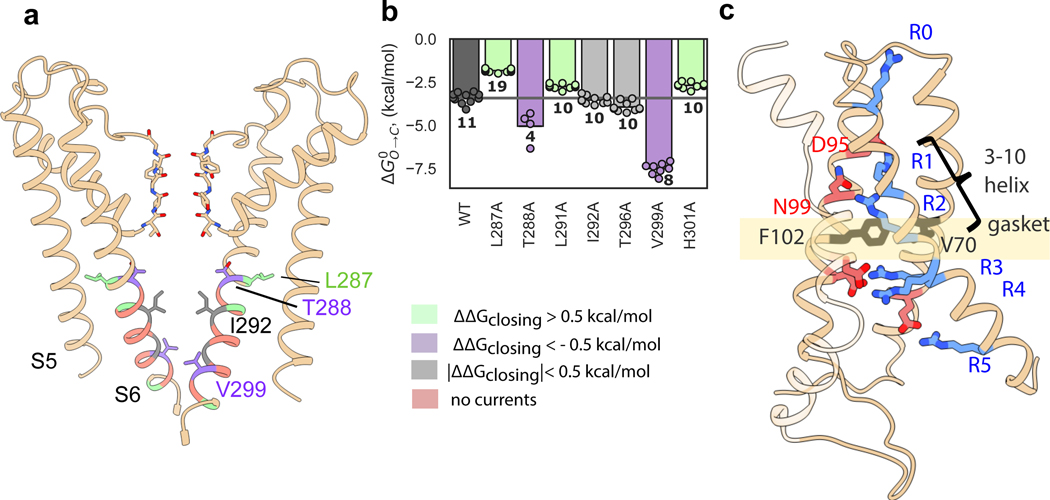
Figure 2: KAT1 pore and voltage-sensing domain structure; alanine scanning of pore inner gate region.
a, View of pore, with only two subunits shown for clarity. Sticks are shown for selectivity filter residues, as well as inner gate-forming residue I292, as well as functionally-important residues L287, T288 and V299. Residues are colored by effect of alanine mutagenesis (see legend inset). b, Deactivation energies of alanine mutants, calculated from G-V relations (Extended Data Fig. 4b). Shown are wild-type (n = 11), L287A (n = 19), T288A (n = 4), L291A (n = 10), I292A (n =10), T296A (n = 10), V299A (n = 8), H301A (n = 10) where n = X biologically independent cells. c, Rotated views of KAT1em VSD. Stick side chains are shown for the hydrophobic gasket: F102 and V70, for key residues on S4: R165 (R0), R171 (R1), R174 (R2), R176 (R3), R177 (R4), R184 (R5), and for counter-charges/dipoles: E63, D95, N99, D105, D141.

