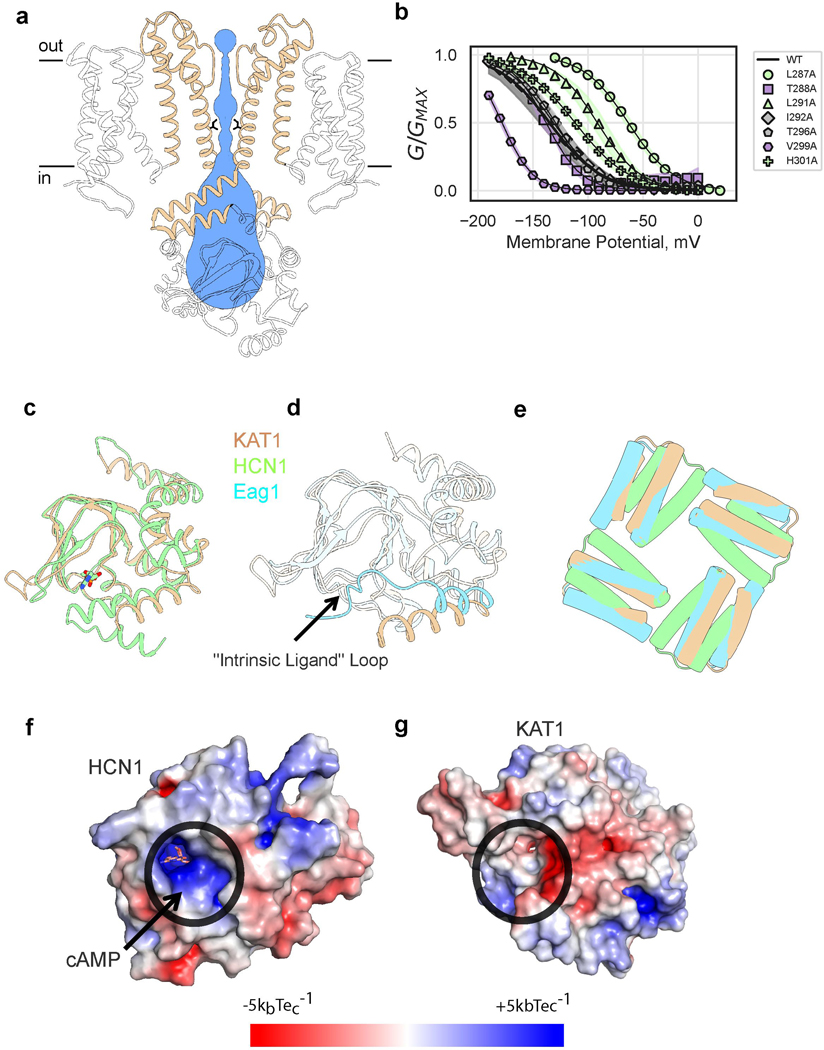
Extended Data Figure 4: KAT1em pore domain and pseudo cyclic nucleotide binding domain.
a, Side view of pore, with only two subunits shown for clarity. Permeation pathway is shown in blue, with inner gate radius calculated by MOLE38 (1.4 Å) or HOLE39 (1 Å), inner gate-forming I292 side chains shown as sticks. b, G-V relations of pore alanine scan. Shaded error regions represent standard deviation, surrounding the symbols which represent the mean. Shown are wild-type (n = 11), L287A (n = 19), T288A (n = 4), L291A (n = 10), I292A (n =10), T296A (n = 10), V299A (n = 8), H301A (n = 10) where n = X biologically independent cells. c, Overlay of KAT1em pseudo-CNBD (tan) and holoHCN1 CNBD (green,PDB ID: 5U6P). The ligand, HCN1-cAMP is shown as sticks in cAMP binding pocket. d, Overlay of KAT1em (tan) and Eag1 (blue, PDB ID: 5K7L). KAT1 lacks “intrinsic ligand” loop of Eag1. e, Top-down view of KAT1em (tan), holoHCN1 (green) overlay, and Eag1 (blue). Structures were aligned/superimposed based on TMD helices. Only C-linker hairpins are shown for clarity to compare relative rotation of the C-linker to TMD, for each structure. The relative rotation of the KAT1 C-linker matches that of Eag1, not HCN1. f,g, Surface electrostatic potential of HCN1 (f) and KAT1 (g), respectively. Ligand binding pockets are circled in black. KAT1 lacks a deep electropositive (blue) pocket as seen in HCN1.

