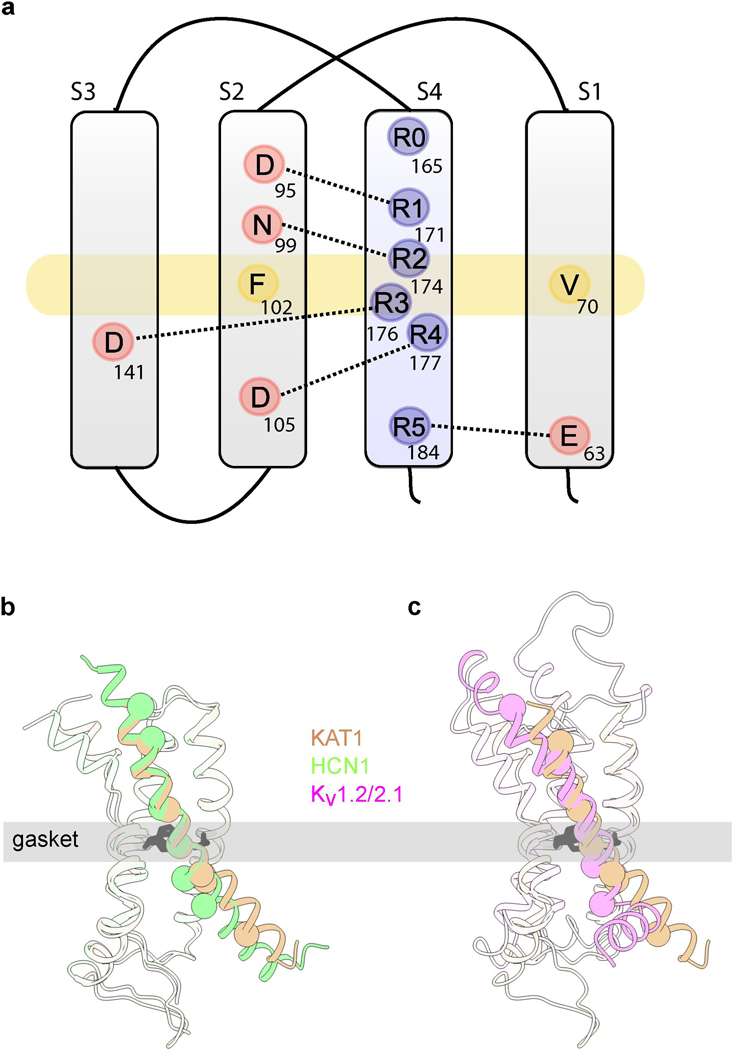
Extended Data Figure 5: The voltage-sensing domain of KAT1em in the ‘up’ conformation.
a, Diagram of key VSD features, showing hydrophobic gasket (F102 and V70, yellow) as well as all S4 charges (blue) and distributed countercharges/counter-dipoles (red). b, c, Overlays of KAT1em (tan) with HCN (green, PDB ID: 5U6O) and Kv1.2/2.1 (pink, PDB ID: 2R9R), respectively, highlighting structural differences between S4 helices. Cα atoms of the positively charged residues of S4 are shown as spheres.

