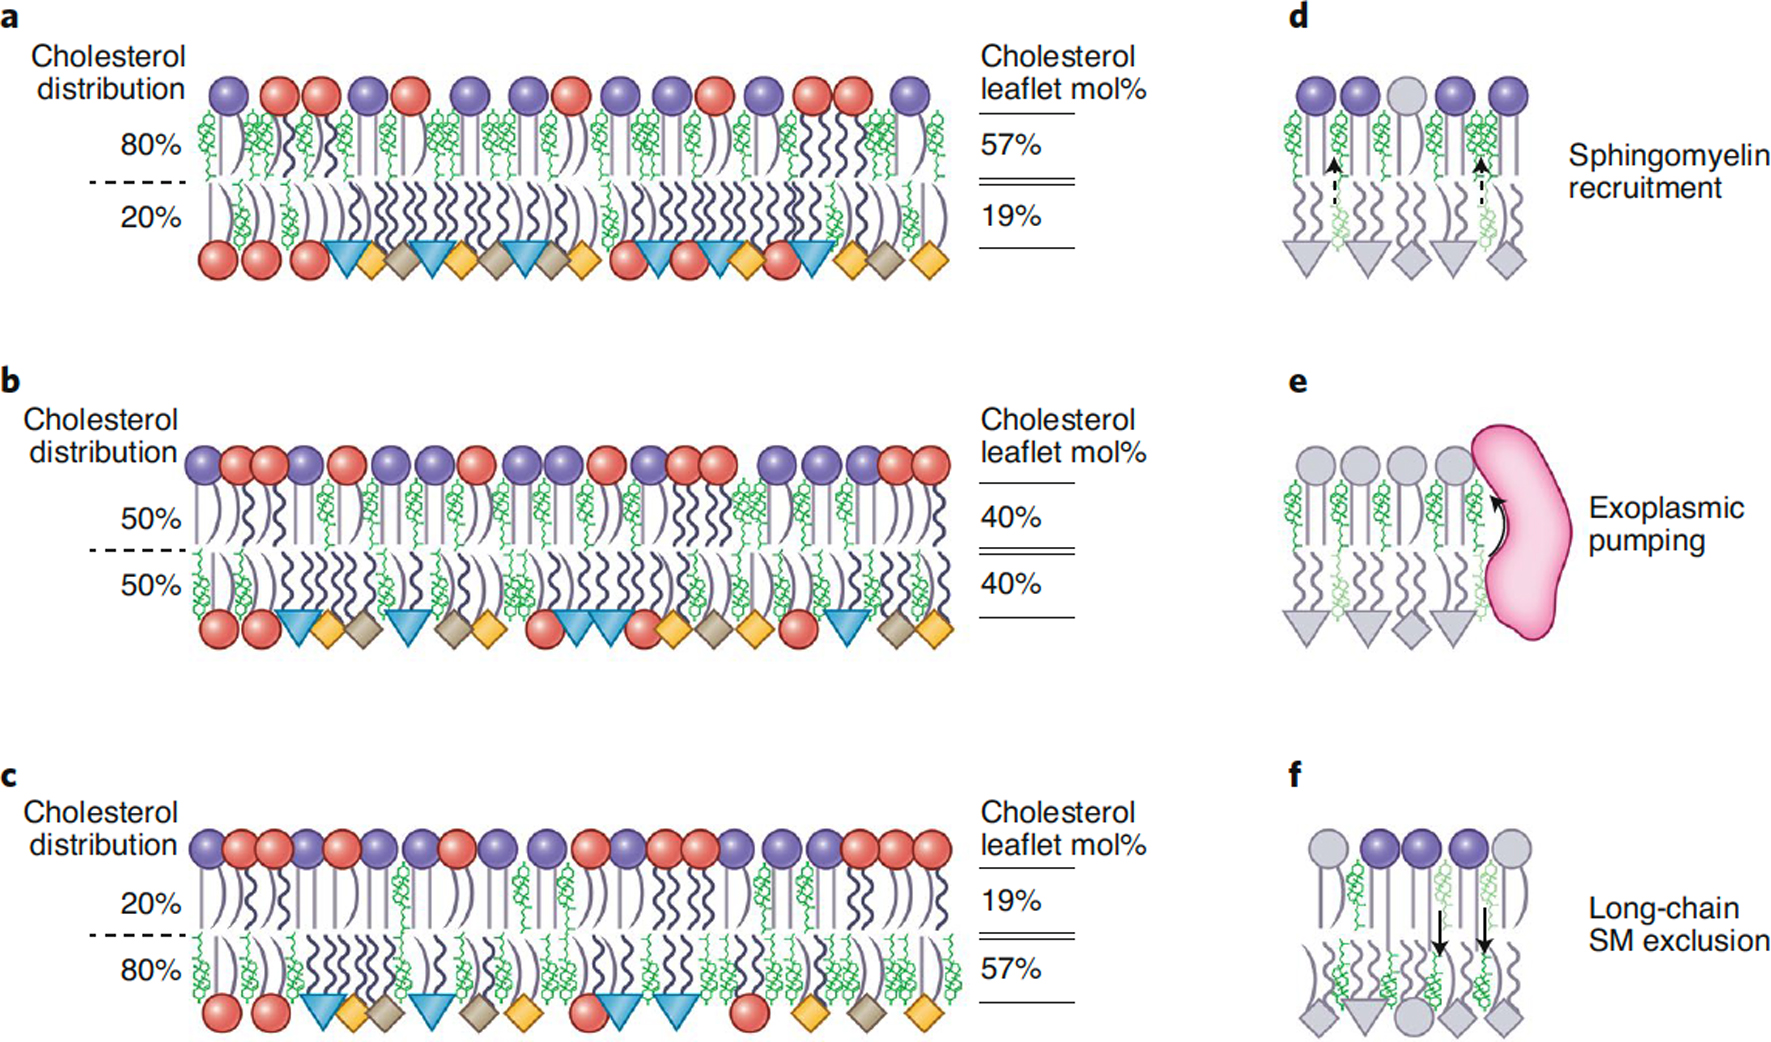
Figure 4. Possible configurations for cholesterol’s interleaflet distribution in the PM.

The same data-driven representation of PL asymmetry as in Fig 1, but with cholesterol (green) enriched either in the (A) top, (B) neither or (C) bottom leaflet, as indicated by the exo/endo percentages (left). In all bilayers the phospholipid compositions of the two leaflets, as well as the total cholesterol mole fraction in the membrane (40%), correspond to those measured in RBC PMs1–3, but the abundance of phospholipids between leaflets varies, resulting in the leaflet cholesterol mol% indicated on the right. An imbalance in total lipid abundance between leaflets may give rise to leaflet stresses (indicated by packing of headgroups) that remain stable as long as the phospholipid asymmetry is maintained. Potential contributors to cholesterol interleaflet distribution include: (D) recruitment of cholesterol to the exoplasmic leaflet by strong preference for saturated sphingomyelin, (E) active pumping of cholesterol to the exoplasmic leaflet by transporter proteins4, and (F) exclusion of cholesterol from the exoplasmic leaflet via long-chain sphingomyelin species5.
