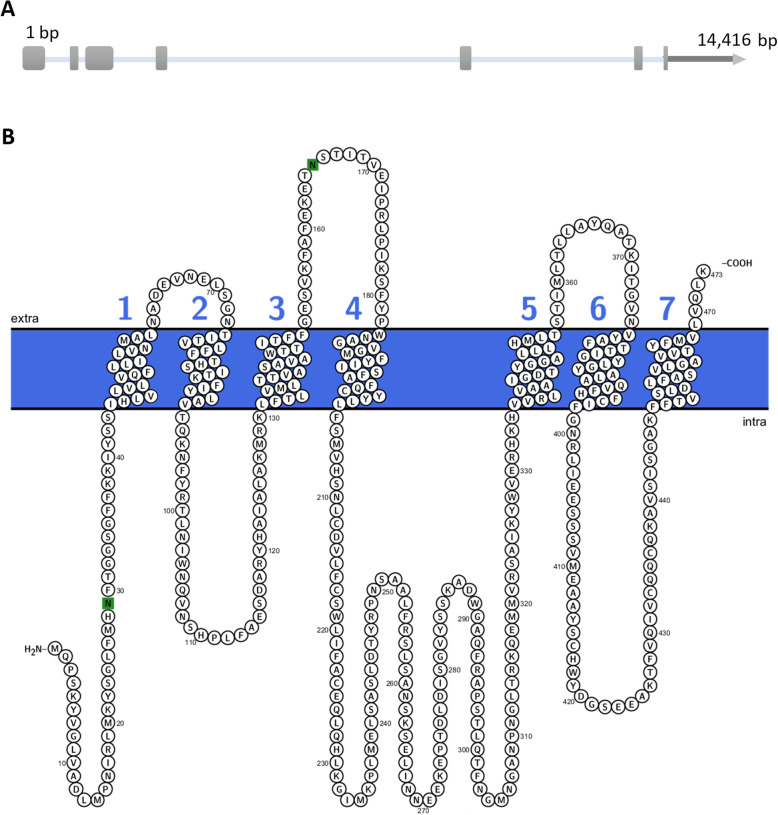
Fig. 1.
The Bo-Orco gene and protein structure. a Schematic representation of the genomic organization of the Orco gene. Grey boxes correspond to the exons and the grey line to the UTR. b Protter plot showing the secondary structure of Bo-Orco. The transmembrane topology of Bo-Orco was predicted using TMHMM. Transmembrane domains are indicated by colored numbers 1–7

