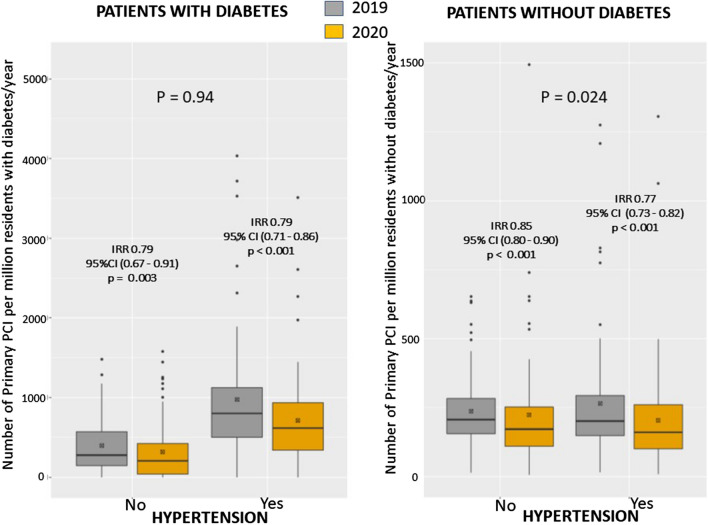
Fig. 4.
Impact of COVID-19 on PPCI procedures according to Diabetes and Hypertension. Box-and-whisker plot showing the number of STEMI patients treated by mechanical reperfusion per million of residents/year in 2019 and 2020 according to hypertension in patients with (left graph) and without (right graph) diabetes. Whiskers extend to the most extreme data point which is no more than 1.5 times the interquartile range from the box. IRR estimates are based on a Poisson model without covariates. A significant interaction was observed with hypertension

