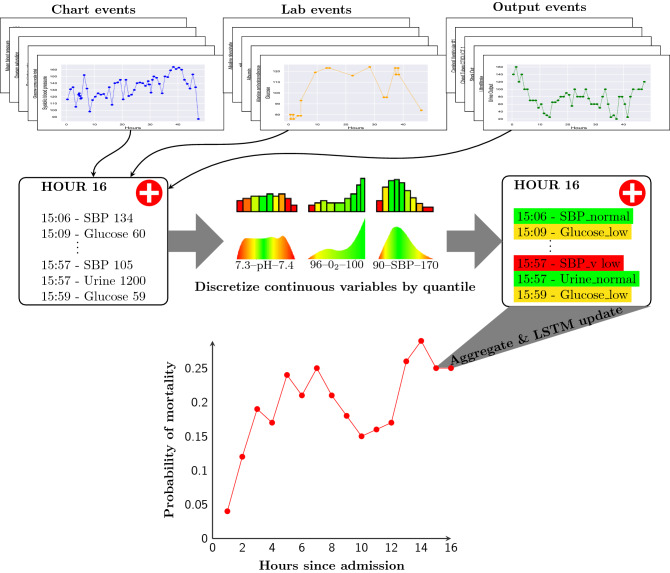
Figure 2.
Diagram of our model. For each patient, all chart, lab, and output events are assembled into fixed time periods. Continuous data, such as Systolic Blood Pressure, Glucose, and Urine Output, are discretized into quantile-based bins, allowing continuous features to be mapped to an embedding. Discrete chart and lab events, from a diverse range of investigations, are equivalently aggregated by the model. Both continuous and discrete events from 1 h of patient timeseries data are embedded and aggregated, using a learnt variable importance ranking (colour in central distributions). The weighted average embedding is then used as input to a LSTM recurrent neural network which generates an updated dynamic prediction of in-hospital mortality probability each hour and updates an internal representation of the patient state. Dynamic prediction allows for continual patient monitoring as new data is accumulated and used to update outcome probabilities. Laboratory values, physiological readings, and admission information was from the first 48 h after ICU admission. LSTM long short-term memory.

