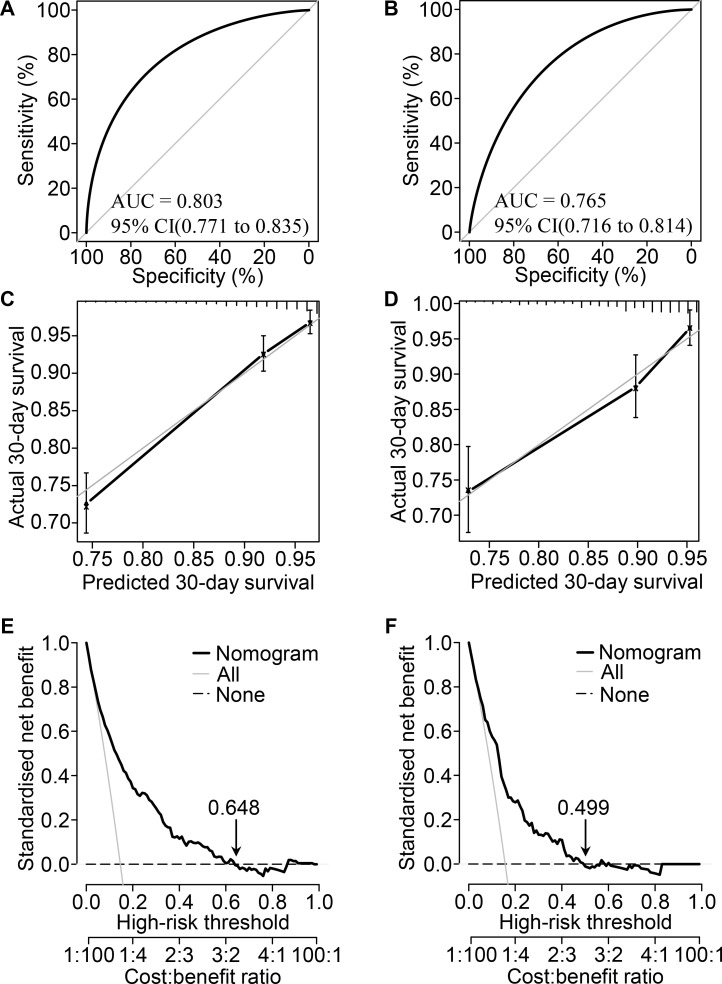
Figure 2.
Performance evaluation of the nomogram in the primary and validation cohorts. Receiver operating characteristic curve analysis in the primary (A) and validation (B) cohorts. Calibration curve analysis in the primary (C) and validation (D) cohorts. The horizontal axis represents the nomogram-predicted probability of 30-day survival, and the vertical axis represents the actual observed 30-day mortality. decision curve analysis for the primary (E) and validation (F) cohorts, implicating the net benefit with respect to the use of the nomogram. AUC, area under the curve.

