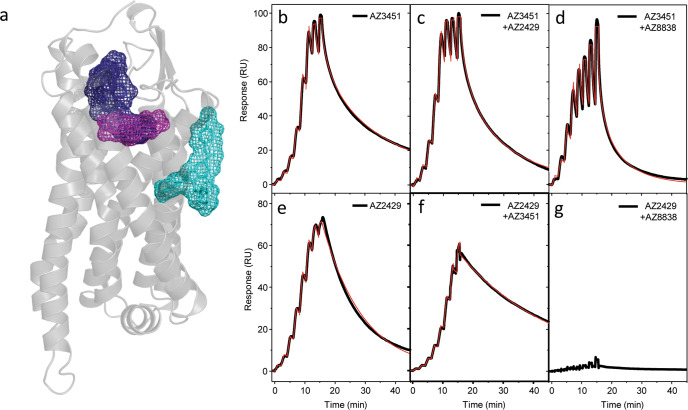
Fig. 3. Interplay between antagonist and agonist binding sites of PAR2 analysed by SPR.
a Schematic representation of compound binding sites within PAR2: agonist AZ2429 binding site (blue) shows a partial overlap with the fragment binding site of AZ8838 (magenta), while the AZ3451 binding site (cyan) is on the outside of the helical bundle. Single-cycle kinetic measurements were used to generate the sensorgram profiles of AZ3451 binding to b apo-PAR2, c the PAR2-AZ2429 complex and d the PAR2-AZ8838 complex. AZ2429 binding to e apo-PAR2, f the PAR2-AZ3451 complex and g the PAR2-AZ8838 complex was measured in a similar manner. Black curves depict the raw data, whilst the red curves represent the fitting of the raw data to a 1:1 binding model. The extracted kinetic data are reported in Table 3.

