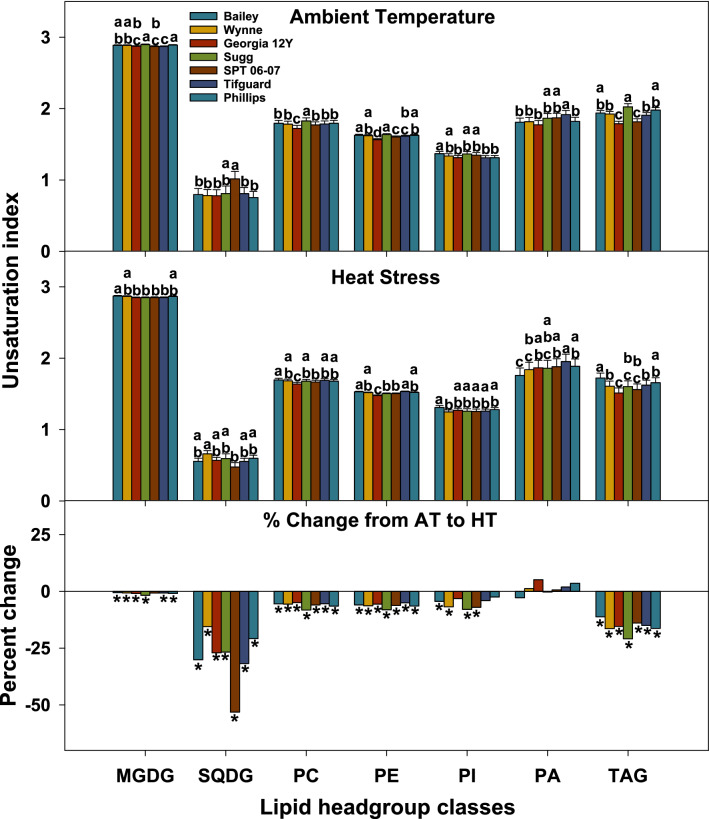
Figure 3.
Changes in unsaturation index of various lipid classes in peanut anthers in response to heat stress. The unsaturation index for a lipid molecular species was calculated as the average number of double bonds per acyl chain, which is the number of double bonds in the lipid molecular species divided by the number of acyl chains. The unsaturation index of a lipid headgroup class was calculated as: Values shown are least squares means. Error bars represent standard errors about the least-squares mean of 16 observations (2 years × 2 blocks × 4 replications) except for Sugg and SPT 06-07, which each have 8 observations (1 year × 2 blocks × 4 replications). Least-squares means with different letters are significantly different according to Fisher’s least significant difference (LSD) test at α = 0.05. An asterisk (*) above bars indicate a significant difference at α = 0.05 between AT and HT for that genotype. AT, ambient temperature (31/22 °C for 2018 and 28/22 °C for 2019; average day/night temperatures during the 17- d and 18-d treatment periods in 2018 and 2019, respectively); HT, high temperature (41/27 °C for 2018 and 38/26 °C for 2019). MGDG, monogalactosyldiacylglycerol; PA, phosphatidic acid; PC, phosphatidylcholine; PE, phosphatidylethanolamine; PI, phosphatidylinositol; SQDG, sulfoquinovosyldiacylglycerol; TAG, triacylglycerol. Data from 2 years (2018 and 2019) were pooled together for analysis.

