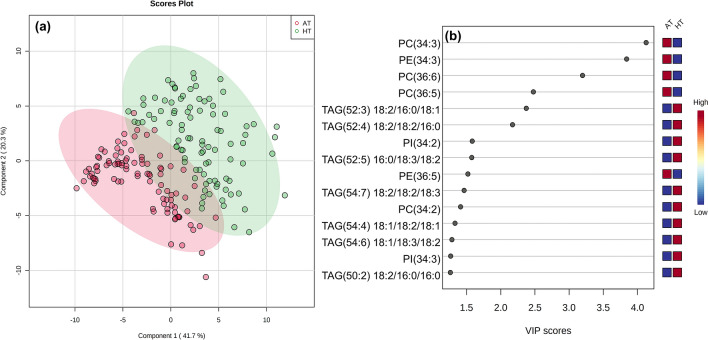
Figure 6.
Partial least squares-discriminant analysis (PLS-DA) scores plot (a) demonstrating the differentiation of the two treatments: ambient temperature (AT, 31/22 °C for 2018 and 28/22 °C for 2019; average day/night temperatures during the 17-days and 18-days treatment periods in 2018 and 2019, respectively) and high temperature (HT, 41/27 °C for 2018 and 38/26 °C for 2019) and PLS-DA variable importance in projection (VIP) scores (b) that identified the top 15 lipid species that differentiated the treatments. A total of 89 lipid species were analyzed under the two treatments. Data from 2 years (2018 and 2019) were pooled together for analysis. PC, phosphatidylcholine; PE, phosphatidylethanolamine; PI, phosphatidylinositol; TAG, triacylglycerol. Lipid molecular species are identified as total acyl carbons: total double bonds. Acyl-chain composition is included after each TAG lipid species but does not indicate sn positions.

