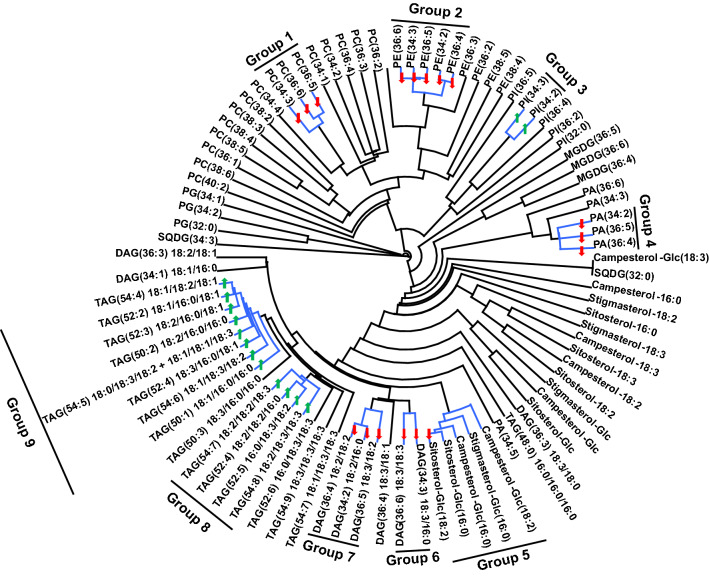
Figure 7.
Dendrogram demonstrating co-occurring lipid groups in peanut anther. All 89 lipid species were clustered using a single-linkage hierarchical algorithm based on Spearman’s correlation coefficient, ρ. Lipid groups with ρ ≥ 0.90 are indicated by blue-colored bars on the dendrogram. The arrows on the dendrogram represent statistically significant changes in the level of each lipid (based on percentage of total signal) under heat stress (41/27 °C for 2018 and 38/26 °C for 2019; average day/night temperatures during the 17-days and 18-days treatment periods in 2018 and 2019, respectively) compared to ambient temperature (31/22 °C for 2018 and 28/22 °C for 2019). Green-colored upward arrows indicate significant increases and red-colored downward arrows indicate significant decreases in the levels of lipids. Data from 2 years (2018 and 2019) were pooled together for analysis. DAG, diacylglycerols; MGDG, monogalactosyldiacylglycerol; PA, phosphatidic acid; PC, phosphatidylcholine; PE, phosphatidylethanolamine; PG, phosphatidylglycerol; PI, phosphatidylinositol; SQDG, sulfoquinovosyldiacylglycerol; TAG, triacylglycerol. Lipid molecular species are identified as total acyl carbons: total double bonds. Acyl-chain composition is included after each DAG and TAG lipid species but does not indicate sn positions. CLUSTER 3.0 was used to determine clusters (Version 1.59, http://bonsai.hgc.jp/~mdehoon/software/cluster/software.htm).

