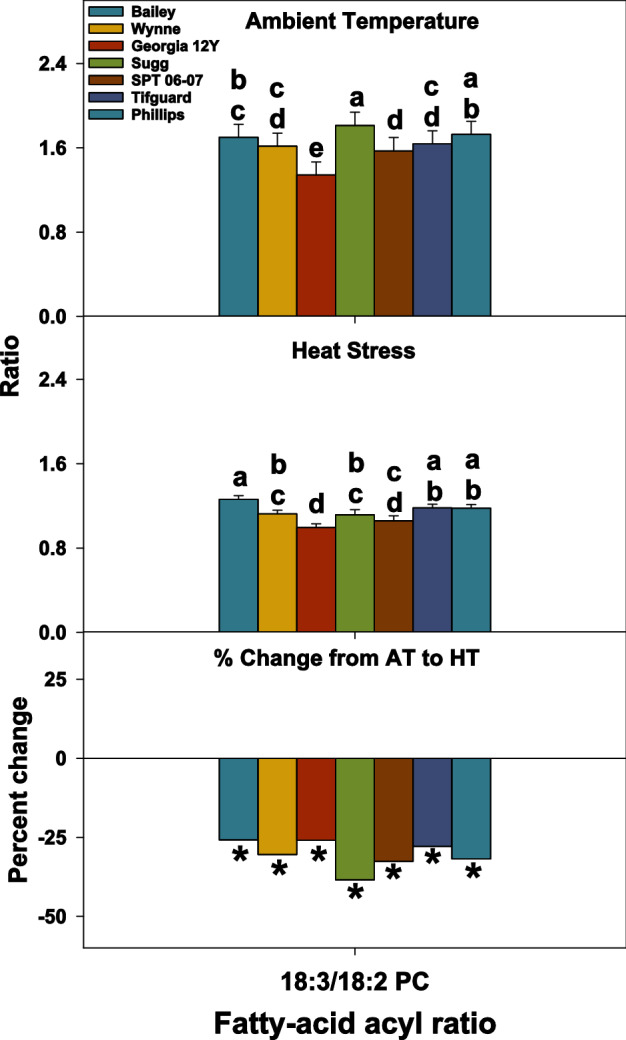
Figure 8.

Changes in 18:3/18:2 phosphatidylcholine (PC) lipid ratio in peanut anthers in response to heat stress. Values shown are least-squares means. Error bars represent standard errors about the least-squares mean of 16 observations (2 years × 2 blocks × 4 replications) except for Sugg and SPT 06–07, which have 8 observations (1 year × 2 blocks × 4 replications). Least-squares means with different letters are significantly different according to Fisher’s least significant difference (LSD) test at α = 0.05. An asterisk (*) above bars indicate a significant difference at α = 0.05 between AT and HT for that genotype. AT, ambient temperature (31/22 °C for 2018 and 28/22 °C for 2019; average day/night temperatures during the 17-days and 18-days treatment periods in 2018 and 2019, respectively); HT, high temperature (41/27 °C for 2018 and 38/26 °C for 2019). Data from 2 years (2018 and 2019) were pooled together for analysis. Lipid molecular species are identified as total acyl carbons: total double bonds.
