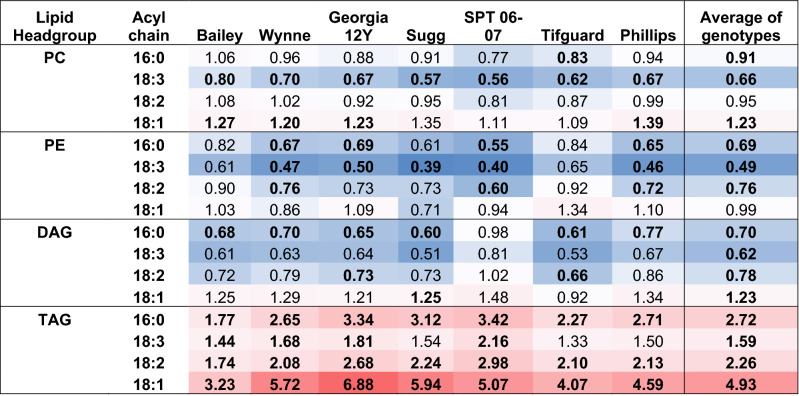
Table 1.
Fold change of fatty acid for HT/AT in each lipid class.
Lipid molecular species for which the fatty acyl composition is unambiguous were used in the analysis. For PC, this included 34:4 (16:1/18:3), 34:3 (16:0/18:3), 34:2 (16:0/18:1), 34:1 (16:0/18:1), 36:6 (18:3/18:3), 36:5 (18:2/18:3), and 36:1 (18:0/18:1). For PE, 34:3 (16:0/18:3), 34:2 (16:0/18:1), 34:1 (16:0/18:1), 36:6 (18:3/18:3), and 36:5 (18:2/18:3) were included. For DAG, all species were included, and for TAG, all species except TAG(54:5) were included. The fold values were calculated as the sum of (each molecular species times the number of occurrences of the fatty acid in that species) in HT/the sum of (each molecular species times the number of occurrences of the fatty acid in that species) in AT. Lipid molecular species are identified as total acyl carbons: total double bonds. Bolded numbers represent significant changes from AT to HT (α = 0.05; Supplementary Table S3). Red shades represent increase and blue shades represents decrease in fold change. AT, ambient temperature (31/22 °C for 2018 and 28/22 °C for 2019; average day/night temperatures during the 17- d and 18-d treatment periods in 2018 and 2019, respectively); HT, high temperature (41/27 °C for 2018 and 38/26 °C for 2019). DAG, diacylglycerol; PC, phosphatidylcholine; PE, phosphatidylethanolamine; TAG, triacylglycerol.

