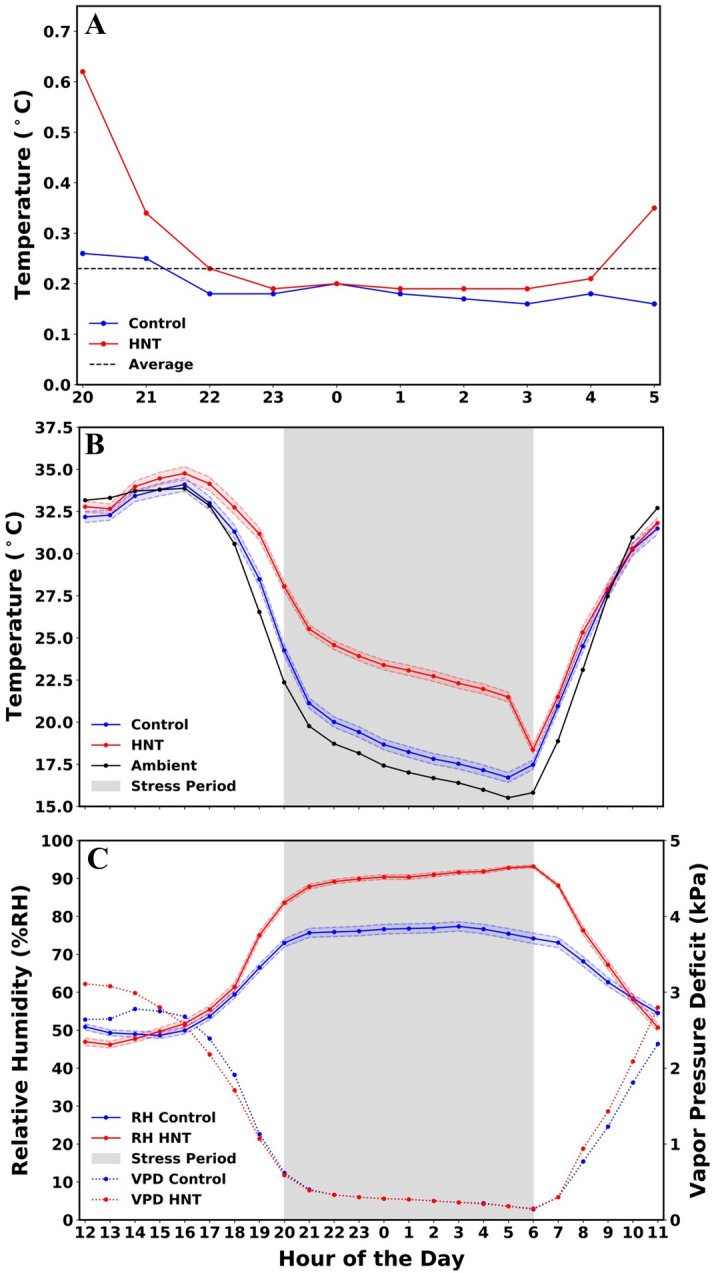
Figure 3.

Environmental conditions in control and stress tents. (A). Comparison of the temperature differences between the HOBO data loggers within the same tents for control, HNT and overall average. The lower the temperature on the graph represents a more uniform heat distribution as the sensors were spread randomly throughout each tent, see Fig. 2. (B). A comparison of the average temperature within the stress tents, control tents and ambient conditions starting at 12:00 PM and ending at 12:00 AM over the entire duration of the experiment. (C). The control and stress tents average relative humidity and vapor pressure deficit are shown throughout the day. 95% confident intervals are represented by the shaded regions above and below the control and stress lines for temperature (B) and relative humidity (C).
