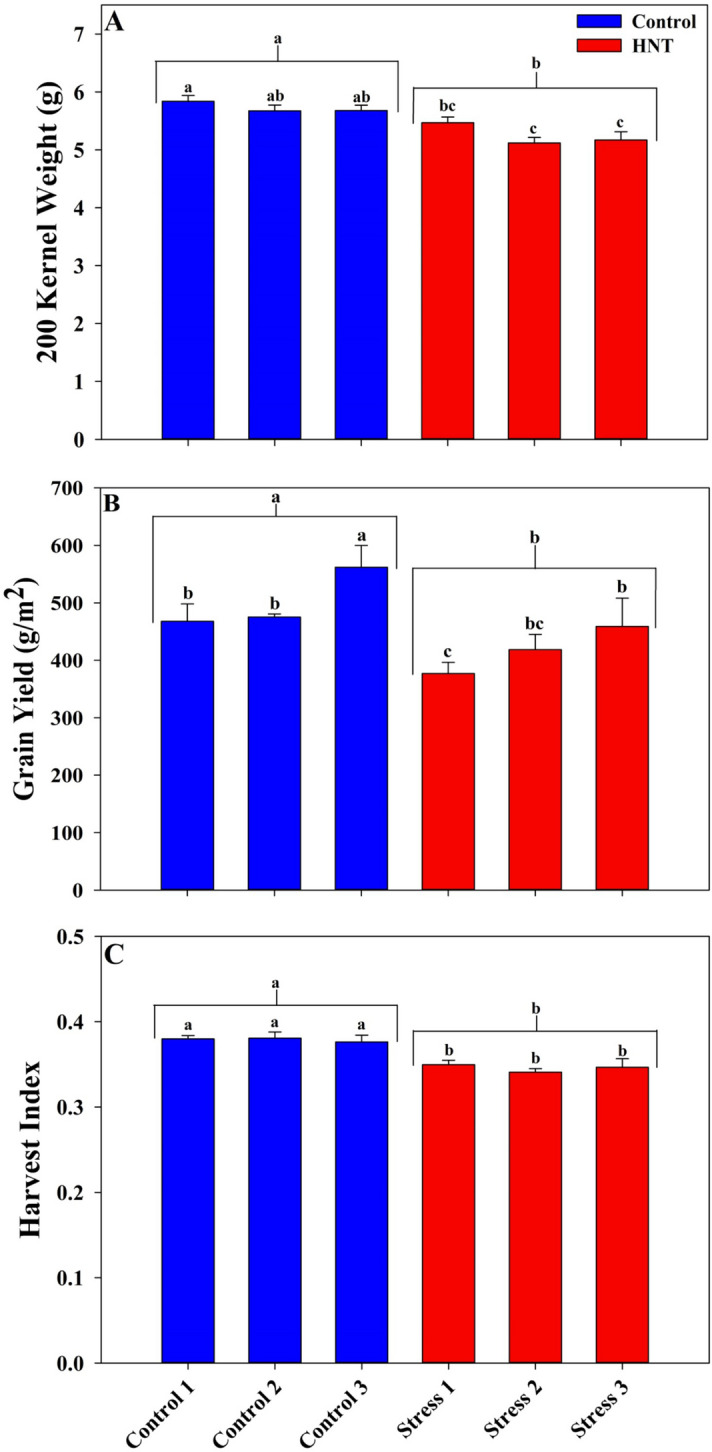
Figure 4.

Comparison of Everest check lines planted randomly in each of the eight blocks within a tent. Comparison of 200 Kernel Weight (g) (A), grain yield (g/m2) (B) and Harvest index (C) in the three control and stress tents. Each column is an average of eight rows of check line Everest and bars indicate ± SE. Letters above the bars indicate groups differing significantly between individual stress repetitions and the letters above the brackets indicate groups differing significantly between overall average between control and stress groups (p < 0.05).
