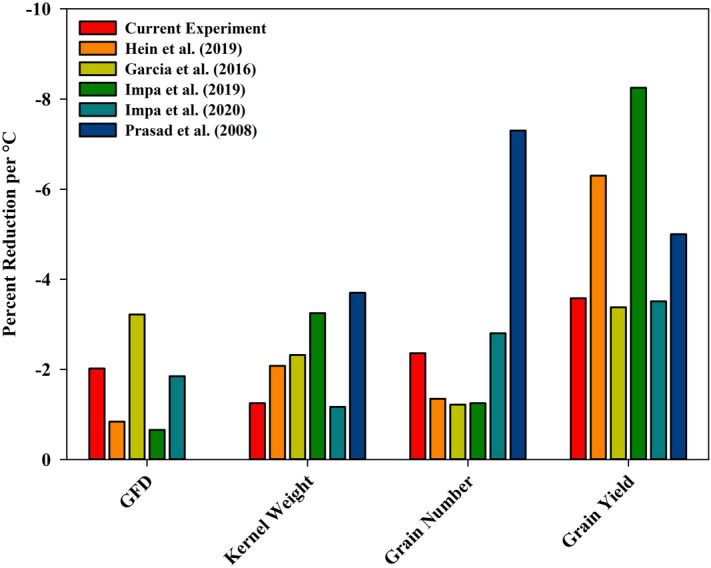
Figure 6.

Graphical comparison of HNT stress impact on key agronomic parameters between six independent experiments in wheat. The results are presented as percent reduction per °C of heat stress and represents the average of all genotypes within the experiment. If multiple HNT stress levels were tested in a single experiment, the average reduction was calculated for each treatment level and then the results of each treatment were averaged to gain an overall experimental percent reduction. In the current experiment HNT stress was imposed post-anthesis through maturity with an average stress level of + 3.8 °C and control of 18 °C. In Hein et al.30 (field-based) HNT stress was imposed post-anthesis through maturity with an average stress level of + 3.2 °C with a 22 °C control. Both Hein et al.30 and the current study had 12 winter wheat genotypes. In Garcia et al.28 (field-based) HNT stress was imposed post-anthesis through maturity with an average stress level of + 4.15 °C during two different years (+ 4.9 °C with a 17 °C control and + 3.4 °C with a 14.3 °C control) with a single genotype of winter wheat. In Impa et al.23 (controlled environment growth chamber) HNT stress imposition after heading and maintained a + 8 °C HNT stress through maturity with a 15 °C control, using six different genotypes. In Impa et al.24 (controlled environment growth chamber) HNT stress was applied post-anthesis through maturity. The experiment had five levels of heat stress (+ 3, + 6, + 8, + 10, and + 12 °C) and a 15 °C control and 10 different genotypes. In Prasad et al.26 (controlled environment growth chamber) HNT stress applied at the booting stage until maturity. The experiment had three levels of heat stress (+ 3, + 6, and + 9 °C) with a 14 °C control and utilized two spring wheat cultivars.
