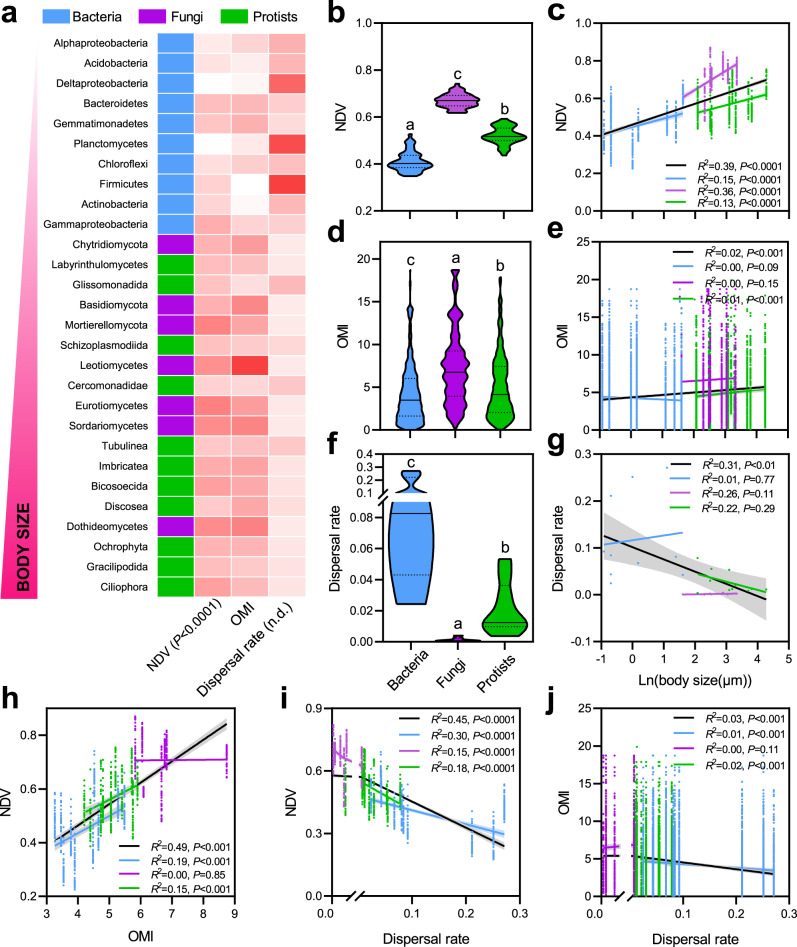
Fig. 4. Community assembly processes of soil organisms in paddy systems.
a Heat map displaying the null deviation value (NDV), outlying mean index (OMI), and dispersal rate of the 28 organism groups. Darker colors indicate bigger values, and n.d. indicates absence of correlation. Violin plots displaying NDV (b), OMI (d), and dispersal rate (f) of bacteria, fungi, and protists. The lowercase indicates significant difference between groups (P < 0.05) via one-way ANOVA and Tukey’s post-hoc tests. Correlations between the logarithm of body sizes and NDVs (c), OMIs (e), and dispersal rates (g); correlations between NDVs and OMIs (h) and dispersal rates (i); and correlations between OMIs and dispersal rates (j). Significant correlations were found using all 28 organism groups, bacterial groups, fungal groups, and protistan groups. The statistics are for the regression of all data points. Lines represent the least squares regression fits and shaded areas represent the 95% confidence intervals. We applied one-sided F test and two-sided t test, and the calculated P values as shown.

