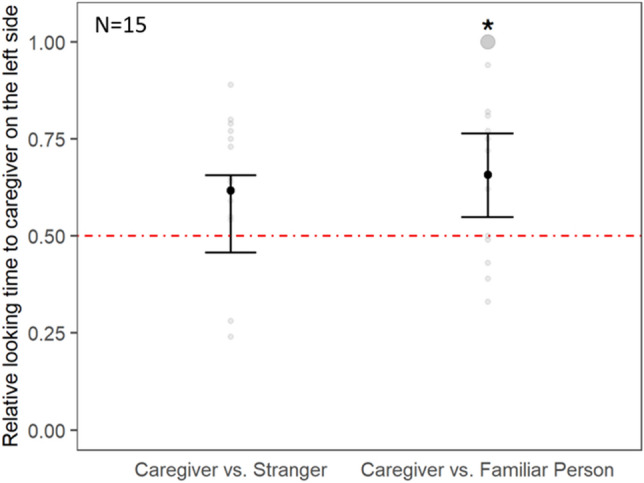
Figure 2.

Dogs’ relative looking time to the caregiver presented on the left screen side in Experiment 2a (left; caregiver vs. stranger) and 2b (right; caregiver vs. familiar person). The red dash-dotted line represents the chance level (0.5), GLMM: *p < 0.05. The bootstrapped 95% confidence intervals of the model are indicated by the vertical black lines. The grey points represent the individual looking patterns of each dog per experiment. The size of the points is proportional to the number of individuals.
