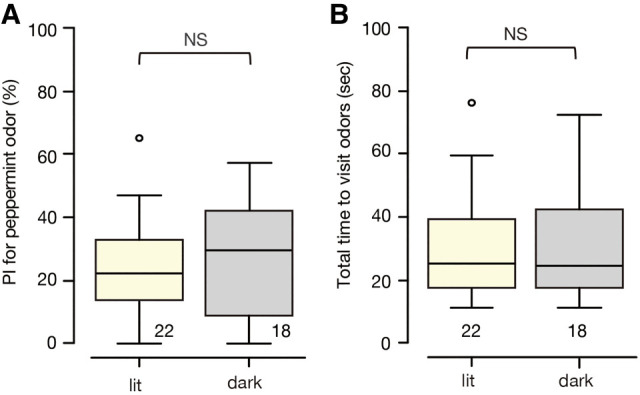
Figure 2.

Relative preference and total search time for odors of two groups of naïve (untrained) crickets tested under illumination or in the dark, shown as box plots. Outliers are shown as open circles. (A) Relative preference between peppermint and vanilla odors are shown as preference index (PI) for peppermint odor. (B) Total time to visit odors. Statistically significant differences are indicated by asterisks. M–W test, (NS) P > 0.05. The sample size is shown at each graph.
