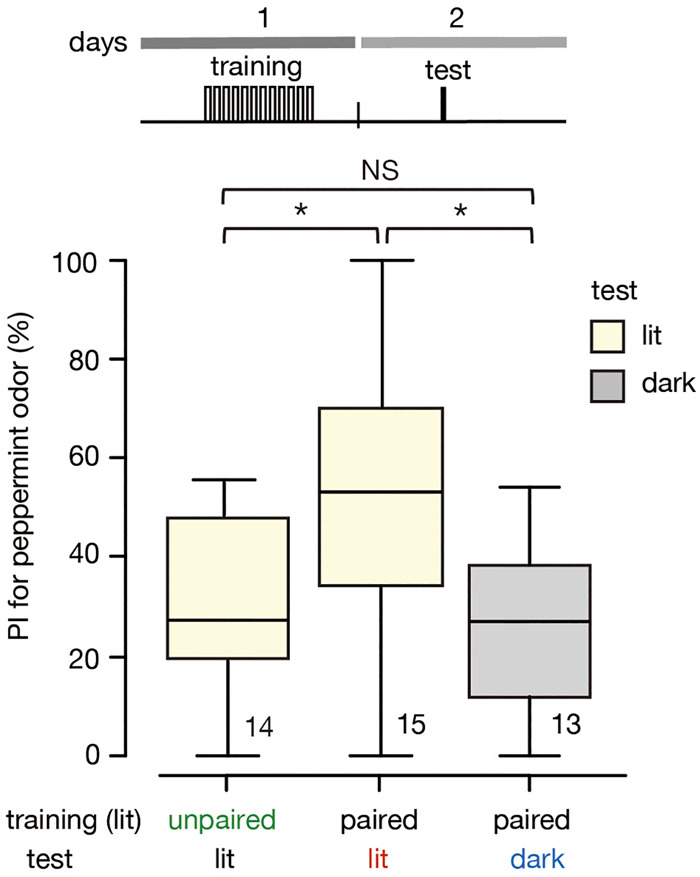
Figure 5.

Effect of context switch on odor preference of groups that received 12 trials × 1 d of training. Relative preference for peppermint odor shown by two groups that received 12 trials × 1 d of training under illumination and that were tested under illumination (12 trials-same group) or in the dark (12 trials-different group). Relative preference for peppermint odor shown by another group that received both 12-trials × 1 d of unpaired training and testing under illumination (12 trials-unpaired group). The odor preference is shown as the PI for the conditioned odor. The top trace indicates the schedule of training and test. Statistically significant differences are indicated by asterisks. M–W test, Holm's method, (NS) P > 0.05, (*) P < 0.05. The sample size is shown at each graph.
