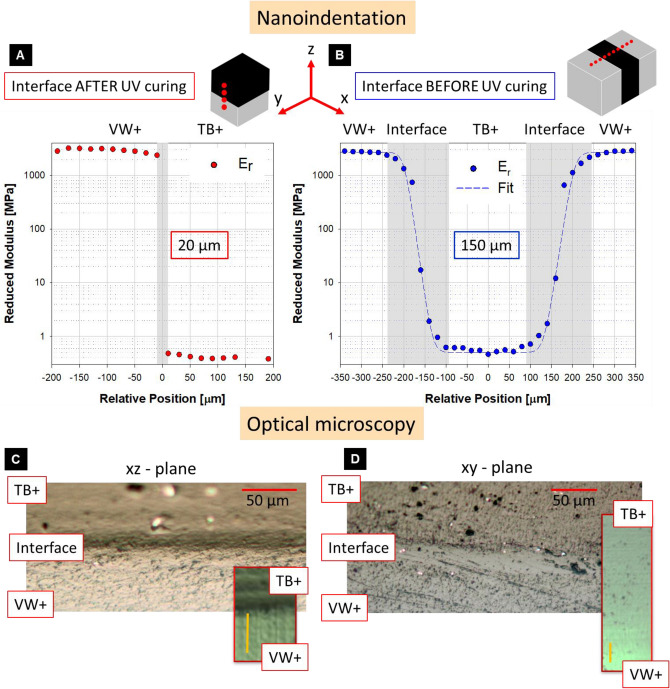
Figure 3.
Nanoindentation and optical microscopy results. Spatial variation in reduced elastic modulus (Supplemetary Information, Eqs. S1 and S3) across bimaterial interfaces formed (A) after and (B) before UV curing. The grey areas in the figures highlight the interface widths in the two scenarios (20 and 150 μm, respectively). At the top, sketch of cuboid samples (TB + and VW + in black and light grey, respectively) showing the printing orientation and indents position. The results are relative to one sample per configuration and to a single indentation line per sample. The other regions which were probed had a quantitatively similar behavior but more data points had to be excluded due to unsatisfactory surface preparation or irregular indentation curves. Inspection of the polished surface of bimaterial samples with optical microscopy confirmed (C) sharp and (D) broad interfaces for the two printing scenarios. Insets show close-up on the interface region on the cryomicrotome-smoothed samples used for nanoindentation (scale bar 25 μm).

