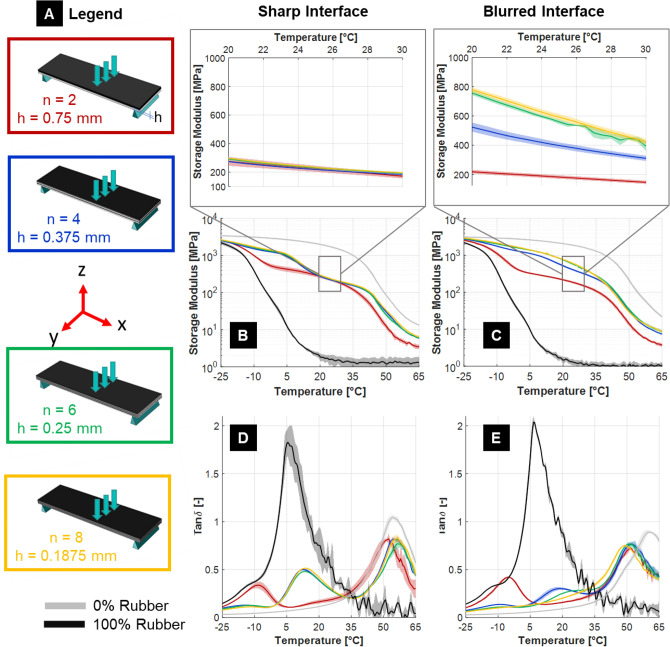
Figure 5.
(A) Configurations with layers stacked along the thickness of the samples (n is the total number of layers and h is the layer thickness). All samples were tested with the TB + layer always on top. (B) Storage modulus and (D) loss factor (Tan δ) for composites having sharp bimaterial interfaces (i.e. formed after UV curing). (C) Storage modulus and (E) loss factor (tan δ) for composites having blurred bimaterial interfaces (i.e. formed before UV curing). The magnifications show detailed trends in the temperature range 20–30 °C. Data reported as mean value over three replicates with shaded area representing one standard deviation interval. Reference curves for pure materials (black TB + and light grey VW +) are also displayed.

