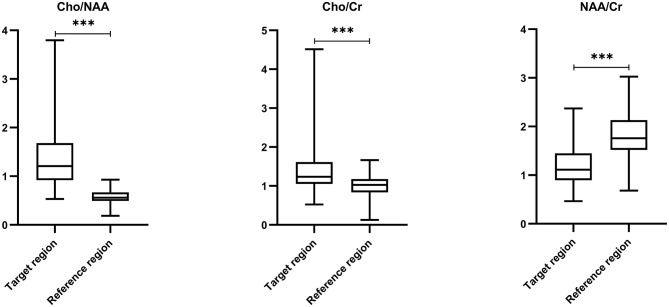
Figure 2.
Comparisons of metabolic ratios between target and reference regions by paired t-test. Comparing with reference region, ratios of Cho/NAA (0.57 ± 0.14 vs. 1.32 ± 0.59) and Cho/Cr (1.02 ± 0.27 vs. 1.36 ± 0.44) in the target region were remarkably increased, but the ratio of NAA/Cr (1.81 ± 0.48 vs. 1.20 ± 0.42) was significantly decreased (P < 0.001). *** p < 0.001.

