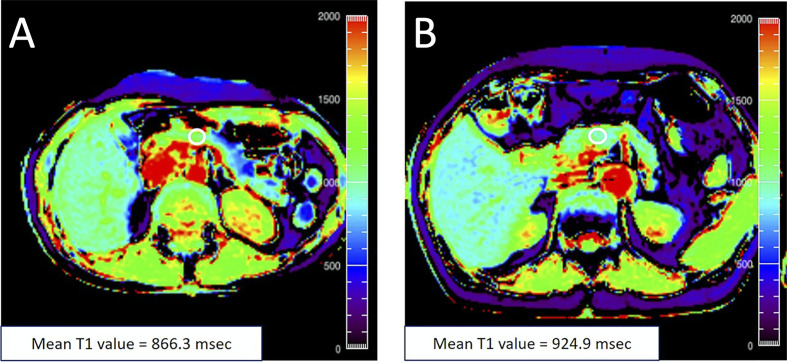
Figure 3.
(A) A 48‐year‐old female with an HbA1c value of 5.5% with T1 map displayed in rainbow color shows the mean pancreatic T1 value of 866.3 msec. (B) A 76‐year‐old female with an HbA1c value of 6.0% with T1 map displayed in rainbow color shows the mean pancreatic T1 value of 924.9 msec. The white circle in each panel indicates a regions-of-interest (ROI) manually placed in the pancreas. Figure adapted from reference (44) with permission, © 2020 John Wiley & Sons, Inc.

