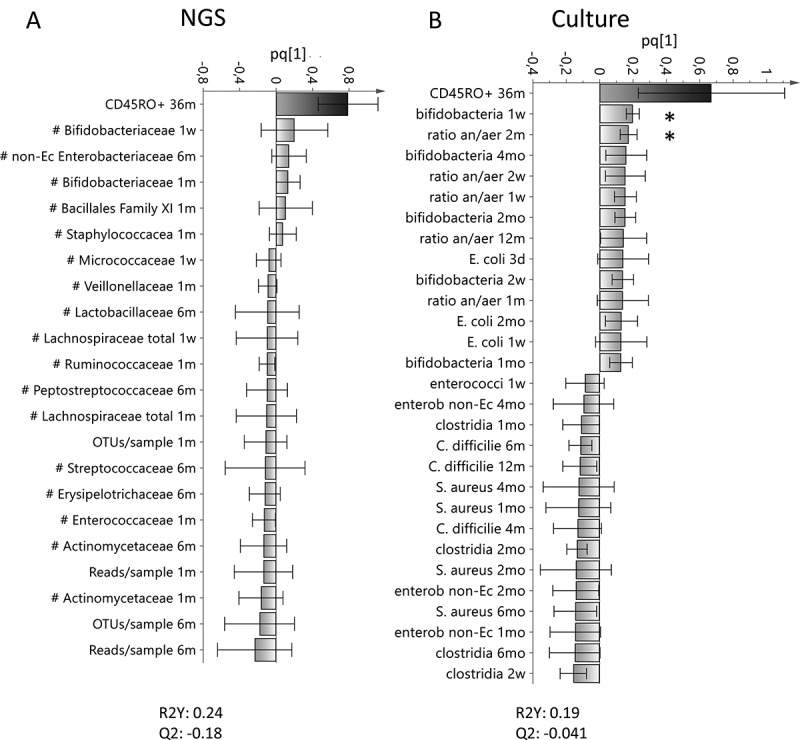
Figure 4.

Associations between the proportion of CD45RO+CD4+ memory T cells and the infantile gut microflora. OPLS column plots depicting the association between early bacterial colonization (X–variables) analyzed with 16S rRNA NGS (a) or culture (b) and the proportion of activated CD4+ that express CD45RO at 36 months of age. X–variables that lie in the same direction as the proportion of activated CD4+ that express CD45RO are positively associated, whereas parameters on the opposite direction are inversely related. Each column displays an uncertainty bar with 95% confidence interval. Asterix depicts associations found to be statistical significant by the use of Mann Whitney’s U test or Spearman rank correlation test (*p < .05)
