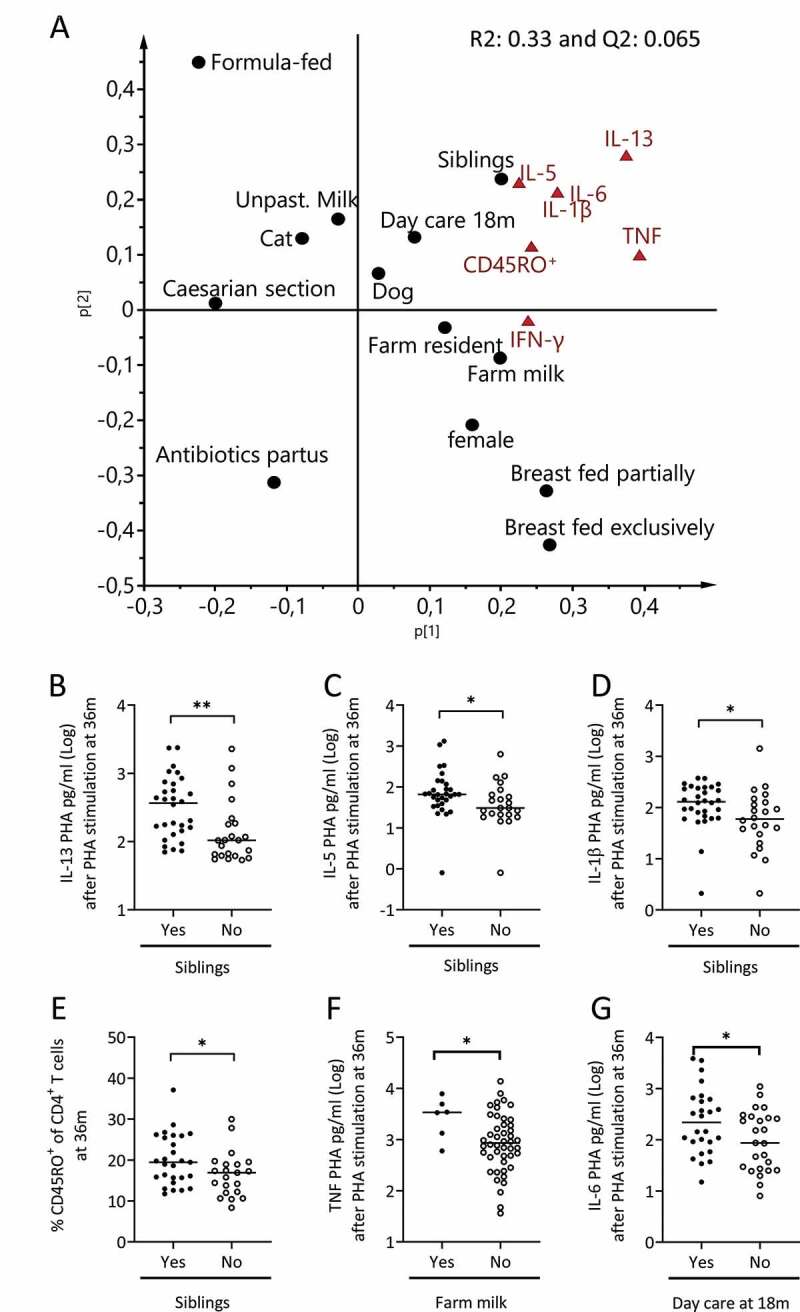
Figure 5.

The relation between environmental factors and the capacity of mononuclear cells to produce cytokines. (a) PCA loading scatter plot depicting the associations between the production of cytokines in response to PHA-stimulation by mononuclear cells obtained at 36 months of age and environmental factors during infancy. Parameters projected on the same side of the Y-axis are positively associated, whereas parameters projected on opposite sides of the Y-axis are inversely related to each other. (b-e) The production of IL-13 (b), IL-5 (c), IL-1β (d) by mononuclear cells and the percentage of CD45RO+ cells within the CD4+ T cell population (e) at 36 months of age by children who either had elder siblings or not. (f-g) the concentration of TNF (f) or IL-6 (g) after PHA-stimulation of mononuclear cells at 36 months of age by children drinking farm milk or not (F) or attending day care at 18 months of age (G). Each dot represents one child, and the horizontal bar represents the median value. Mann Whitney’s U test, *p < .05 and **p < .001
