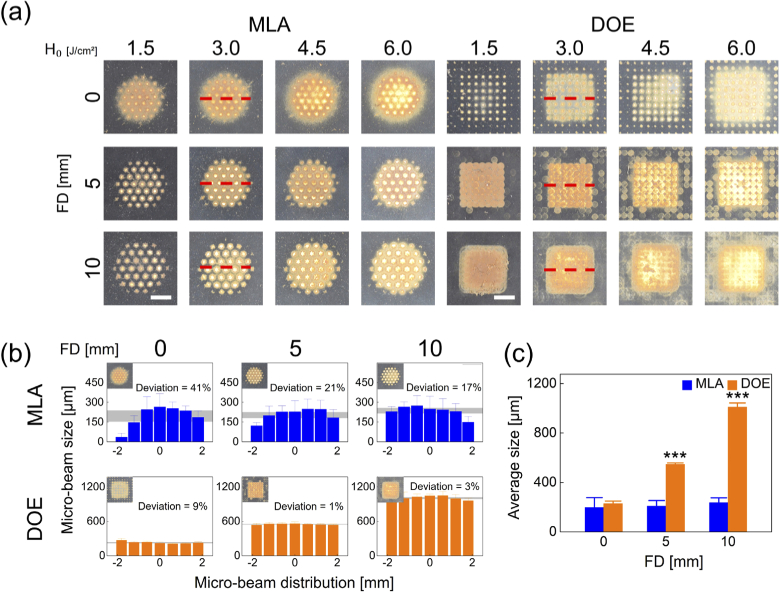
Fig. 1.
Comparison of spatial beam profiles between micro-lens arrays (MLA) and diffractive optical elements (DOE) at various radiant exposures (H0 in J/cm2) and focal depths (FD in mm): (a) top-view images of macro-beam spots on black-colored dimming paper, (b) spatial distributions of micro-beam sizes acquired from middle line (red dashed line) of macro-beam spots (H0 = 3.0 /cm2), and (c) overall micro-beam sizes measured from macro-beam spot (bar = 2 mm; ***p < 0.001 vs. MLA). Gray areas in (b) represent the deviations for the measured micro-beam sizes.

