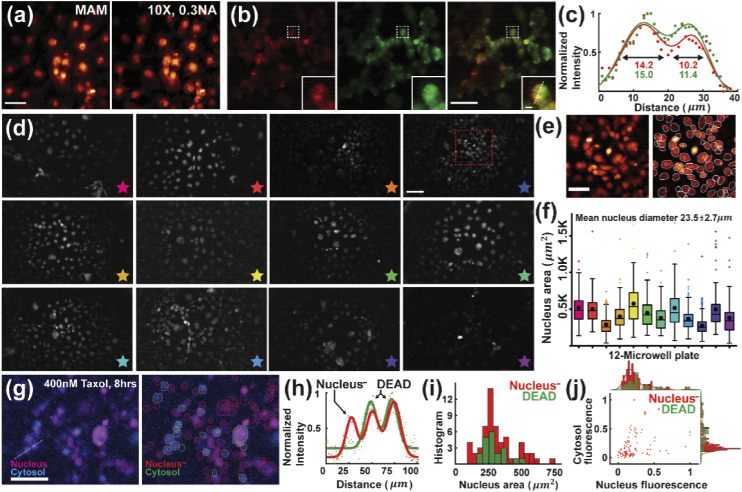
Fig. 3.
MAM imaging of fixed cells. (a) Fixed COS-7 cell population stained with HCS NuclearMask Deep Red and imaged by an up-right MAM module and conventional epifluorescence microscopy using a 10×, 0.3NA objective. (b) HEK-293T cells co-stained with MitoTracker Deep Red (left) and Green (middle) and their merged image (right). The insets show the zoomed-in images of the corresponding boxed regions. (c) Cross-sectional profile of the normalized intensity along the dashed line in (b), showing consistent cell profiles and a good alignment between the two spectral channels. (d) Images of fixed COS-7 cells stained with HCS NuclearMask Deep Red taken by an array of 12 modular devices. (e) Zoomed-in image (left) of the boxed region in (d) and the corresponding segmented cells (right). (f) Measurement of the nucleus area in each modular image, showing an average of the nucleus diameter at 23.5 ± 2.7 µm. Each color of the measurement in (f) corresponds to the modular image marked by the star of the same color. (g) Left, two-color imaging of nucleus and cytosol in COS-7 cells. Right, segmented ROIs mark the dead (cytosol) and active (nucleus-) cells. (h) Normalized intensity profiles of nucleus (red) and cytosol (green) along the dashed line in (g), distinguishing different cell states. (i) Histogram of the nucleus area, showing consistent measurements between dead and active cells. (j) Scattering plot of the corresponding nucleus and cytosol fluorescence intensity of each cell. The histograms show consistent distribution in nucleus fluorescence between dead and active cells while distinct in cytosol fluorescence. Scale bars: 100 μm (a,b,d,g), 50 μm (e), 10 μm (b, inset).

