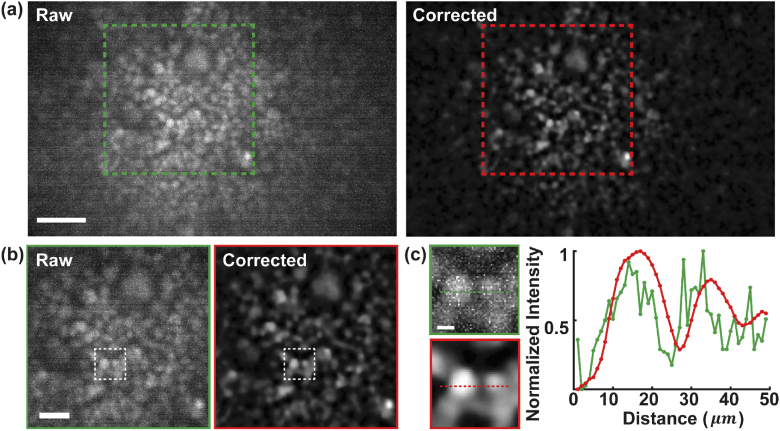
Fig. 10.
Raw and processed images of nucleus-stained COS-7 cells. Red dashed box marks the region of Fig. 4(a) and the same region in raw image. (b) Zoomed-in images of the boxed regions in (a). (c) Zoomed-in images of the boxed regions in (b). Cross-sectional profile of the normalized intensity along the dashed line in (c). Scale bars: 100 µm (a), 50 µm (b), 10 µm (c).

