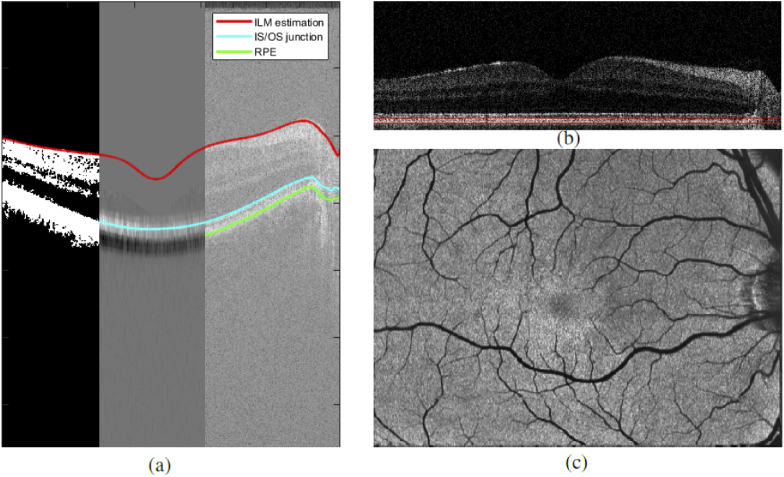
Fig. 5.
Path to high contrast intensity projection images. (a) shows the intermediate segmentation steps. left: ILM estimation via thresholding; middle: IS/OS detection via local gradient; right RPE detection via DOPU image. (b) shows the B-Scan flattened at the RPEwith the 30 thick band for intensity projection image generation drawn in red. (c) shows the final averaged intensity projection image of a scanning region.

