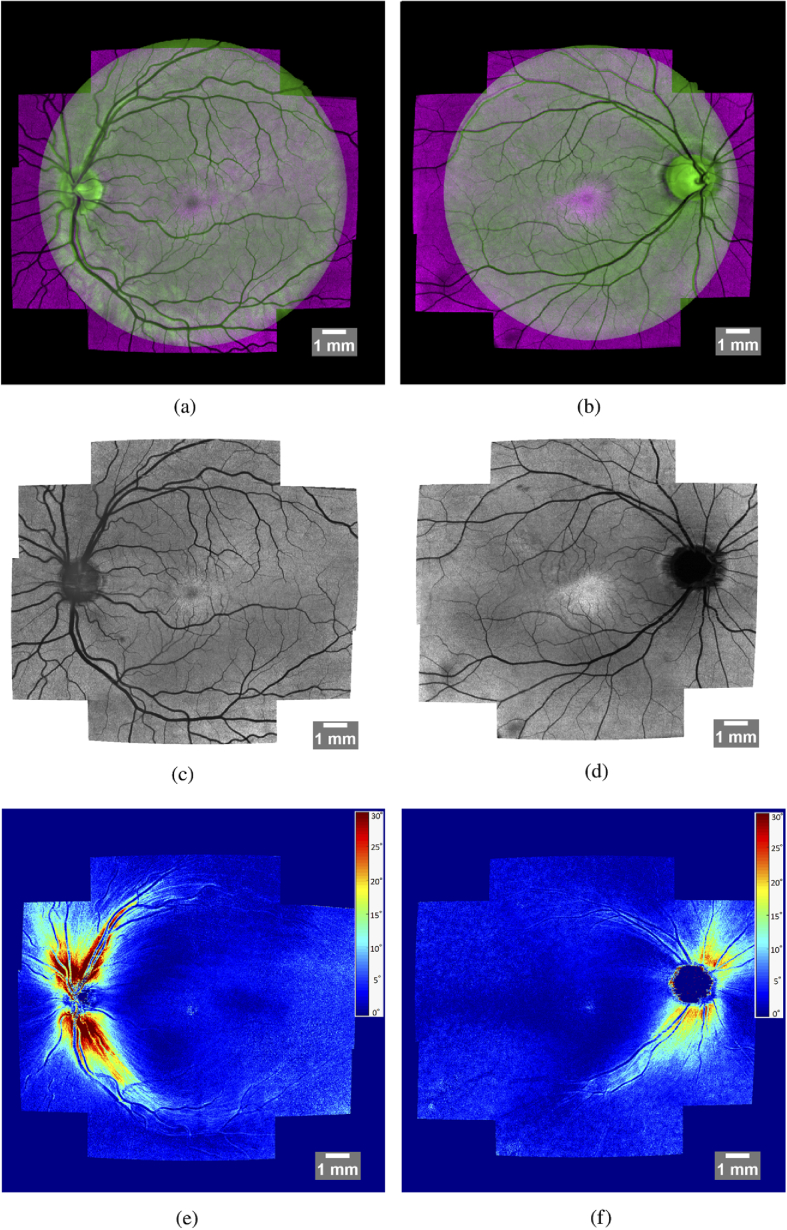
Fig. 12.
Stitched images of a healthy (left column) and an early glaucoma subject (right column). Overlay of stitched intensity projection image and fundus image (a,b), stitched projection of Intensity (c,d), stitched retardation projection (colorscale in degreeof retardation and windowed between and ) (e,f).

