Fig. 2.
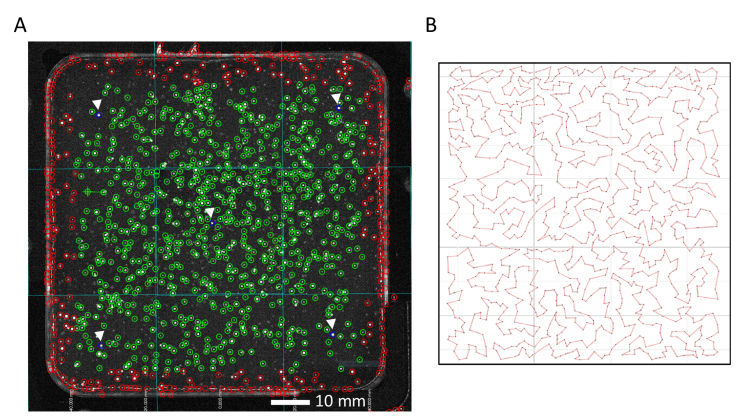
The GIZMO plate map and stage path. A) Example plate map captured by the one-photon arm of the GIZMO, as shown on the GUI. The intersecting aqua lines show where the four overlapping snapshots have been automatically stitched. The open circles indicate auto-detected colonies. Green circles mark the colonies to be scanned. The five blue circles (see white arrows) mark the test colonies to estimate colony Z positions across the plate. Red circles are outside of the designated scan area. B) Example of the time-efficient stage path between colonies generated from an approximate traveling salesman algorithm [22].

