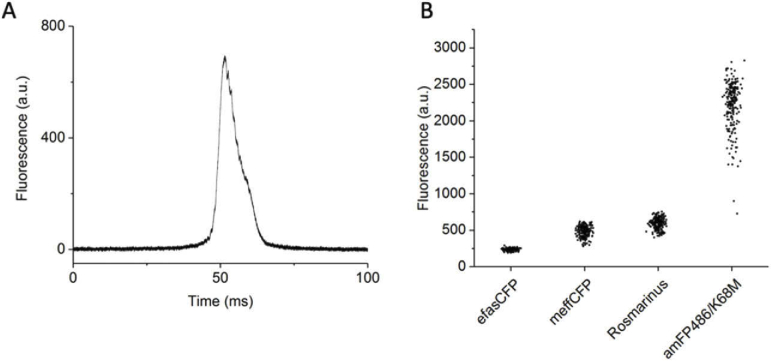
Fig. 3.
The GIZMO can distinguish between known fluorescent proteins. A) Representative raw data of a single colony scan measured by the two-photon arm of the GIZMO. The fluorescence signal detection bandwidth is ∼1 MHz. The relative two-photon excited fluorescence of a colony is taken as the maximum value of a scan. B) The spread of the two-photon excited fluorescence of E. coli colonies as measured by the GIZMO at 840 nm for four different FPs. The relative standard deviation of a single measurement for each FP (n colonies in parentheses) was 6.2% for efasCFP (233), 15% for meffCFP (210), 13% for Rosmarinus (195), and 14% for amFP486/K68M (210). E. coli were transformed with the DNA of each FP at the same time under the same conditions, and the plates were measured the next day. Each transformation was plated in duplicate onto one half of a plate. Shown are data from two representative plates measured sequentially; see Fig. S5(A) for all the plates.

