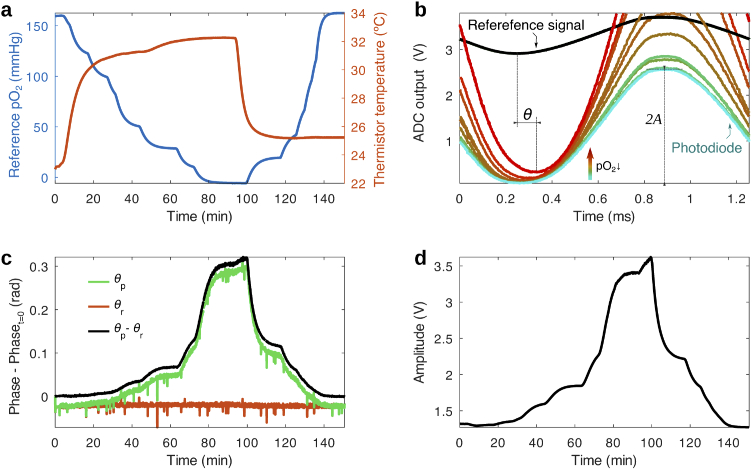
Fig. 2.
Response of the oxygen sensing film to and temperature during a calibration run. (a) Variation of the temperature (measured by the thermistor in the sensor head) and (measured by a commercial oxygen sensor) in a sealed chamber during calibration, in which the oxygen partial pressure is varied by mixing nitrogen and air at different ratios. (b) ADC output of the photodiode and reference signal channels at different points in time throughout the calibration. The photodiode signal reveals how the phosphorescence of the oxygen sensing film changes in amplitude and phase with respect to the reference signal during changes in oxygen (and temperature to a lesser degree). The reference signal remains stable during the measurement. (c) Phase (minus the initial value at ) of the reference and photodiode signal vs time during the calibration period. The relative phase between the photodiode and reference signal, , exhibits high sensitivity to changes in throughout the whole physiological range. (d) Amplitude of the emission vs time, presenting a similar response to the phase. Phase and amplitude are obtained with a multiple linear regression algorithm from the data in (b).

