Fig. 3.
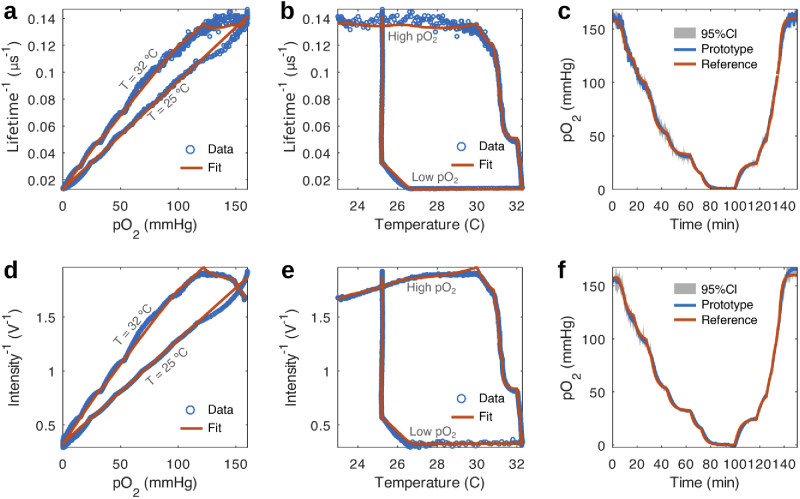
Fits of the temperature dependent Stern-Volmer equation. (a) Stern-Volmer plot of lifetime data and its fit to the temperature dependent Stern-Volmer equation. The model is able to describe the variation of the measured lifetime with changes in partial pressure of oxygen and temperature. (b) Complimentary lifetime data vs temperature. The dependence of lifetime with temperature is accounted for by modelling as a second order polynomial depending on temperature. (c) Comparison of measured by the developed device and a commercial reference sensor along with a 95% confidence interval (CI) of measurements. The estimated from lifetime data reproduces all features observed in the reference data with slight differences attributed to mismatches in sensor speed and temperature compensation. (d), (e) and (f) show equivalent plots for the intensity data revealing similar features.

