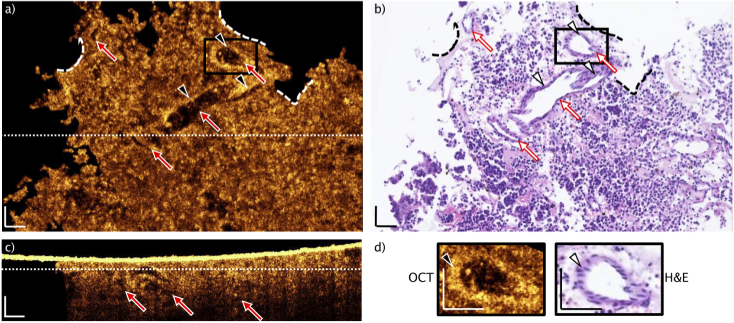
Fig. 4.
Representative of typical paraffin block single slice OCT and H&E correlation of adenoma tissue. After matching the structural features to the H&E slice (dashed lines: landmarks). No larger connected bright structures, besides the endothelial cells confining blood vessels (triangles) can be identified (d). The red arrows point to blood vessels, indicated in the single OCT enface image (a), the H&E slice (b) and the B-scan (c). The positions of the enface and the B-scan are indicated by the dotted lines, respectively. The intense OCT signal in (c) is arising from the air paraffin interface. Scale bars: 50 µm.

