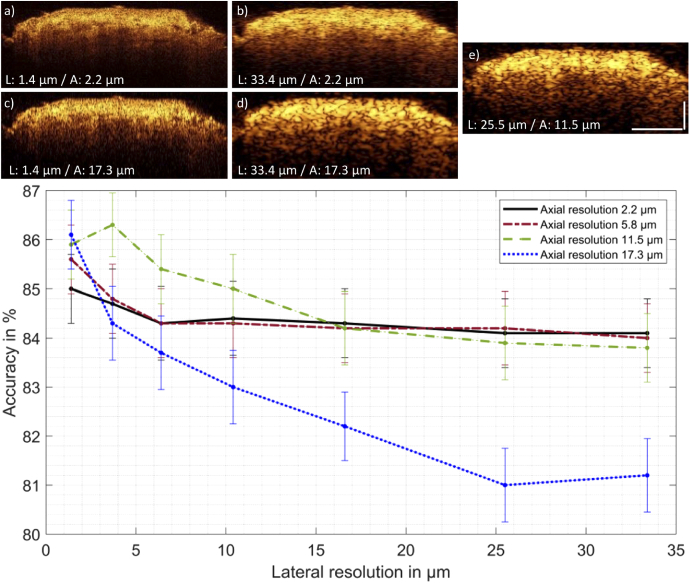
Fig. 7.
Classification of OCT data of pituitary and adenoma. Top: Five representative OCT B-scans of pituitary gland for the extreme cases of lateral (L) and axial (A) resolution adjustments are shown a)-d). e) provide comparable resolution realized in an endoscope applied before [31]. The pituitary adenoma images are treated in the same way and express the same behavior after optical resolution adjustments. All five B-scans have the same dynamic range. Scale bars: 200 µm. Bottom: Achieved accuracy of the classification performed on the chosen OCT data. Error bars represent the 95% confidence interval. The lines in between the data points are no interpolations but serve visual purposes. The qualitative interpretation of the classification outcome indicates, that with decreasing axial resolution the decreasing lateral resolutions has the strongest impact on the classifier’s accuracy. The accuracy is higher than 80% for all cases.

