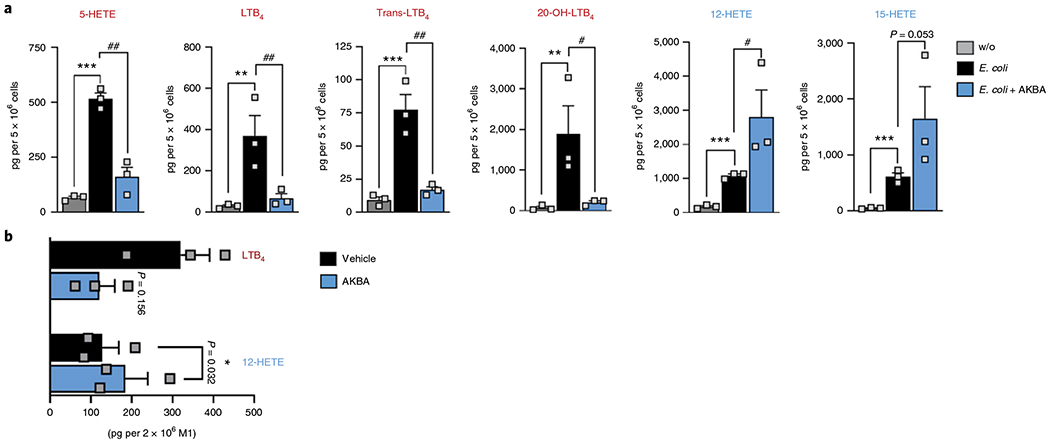
Fig. 6 |. Effects of AKBA on LM formation in human neutrophils and M1-like MDM activated with E. coli.

Cells were preincubated with 10 μM AKBA or vehicle (0.1% DMSO) for 5 min before stimulation with E. coli (multiplicity of infection, 50) for 90 min at 37°C. Formed LM were isolated by solid-phase extraction and analyzed by UPLC-MS/MS. a, Data are shown as pg per 5 × 10⁶ neutrophils as a bar chart of n = 3 independent experiments. Data were log-transformed for statistical analysis. **P < 0.01, ***P < 0.001, E. coli-stimulated cells versus unstimulated control; #P < 0.05, ##P < 0.01, AKBA versus vehicle in E. coli-stimulated cells; ANOVA + Dunnett’s multiple comparisons test. w/o, without. b, LTB4 and 12-HETE levels are shown as pg per 2 × 10⁶ M1-like MDM in a bar chart of n = 3 independent experiments. Data were log-transformed for statistical analysis, *P < 0.05 AKBA versus vehicle in E. coli-stimulated MDM, Student’s paired t-test.
