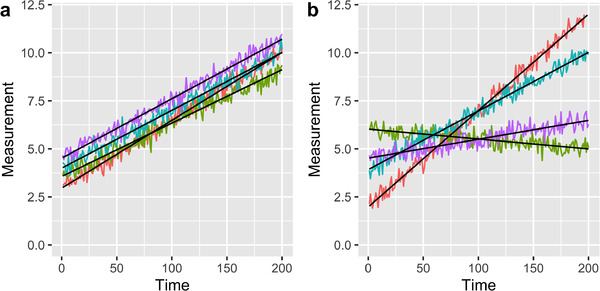
FIGURE 2.

Examples of potential longitudinal data for four subjects. Subjects are represented by different colors. The linear model used to generate the data is displayed in black. Data were generated with equal variation within subjects. (a) Case in which variability between the subjects’ underlying linear model is low, (b) Case in which the variation between subjects’ linear model is high.
