
FIGURE 2.
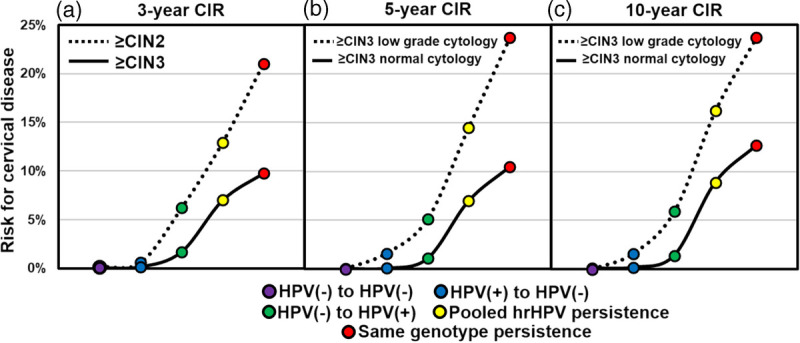
Cumulative incident risk for high-grade cervical disease according to HPV status at the first and subsequent test. Five HPV status classifications are shown, including HPV negative (purple; negative at first and subsequent testing), HPV clearance (blue; HPV positive at first test and HPV negative at second test), new HPV infection (green; HPV negative at first test and HPV positive at the subsequent test), pooled (any genotype) HPV persistence (yellow; any HPV genotype at first test and any HPV genotype at the subsequent test), and genotype-specific HPV persistence (red; positive for the same genotype at the first and subsequent test). Risk estimation, plotted along the y-axis and based on HPV status, is shown in (a) for CIN 2 or higher and CIN 3 or higher over 3 years, in (b) for CIN 3 or higher among individuals with normal and low-grade cytology across 5-years, and in (c) for CIN 3 or higher among individuals with normal and low-grade cytology across 10 years. The disease outcome, 5-, and 10-year time points.